
XRPUSD Medium-term Trend: Ranging
Supply Levels: $0.83, $0.82, $ 0.81
Demand levels: $0.77, $0.78, $0.79
Yesterday, March 9, the XRPUSD pair was in a downtrend when the support level at $0.80 was broken and the price fell to $0.77. However, an explanation was given yesterday on how trend line could be used in trading. In a downtrend, pullbacks or retracements on the trend line are sell signals where traders could place short trades. However, Ripple price was trading at $0.79 at the time of writing.
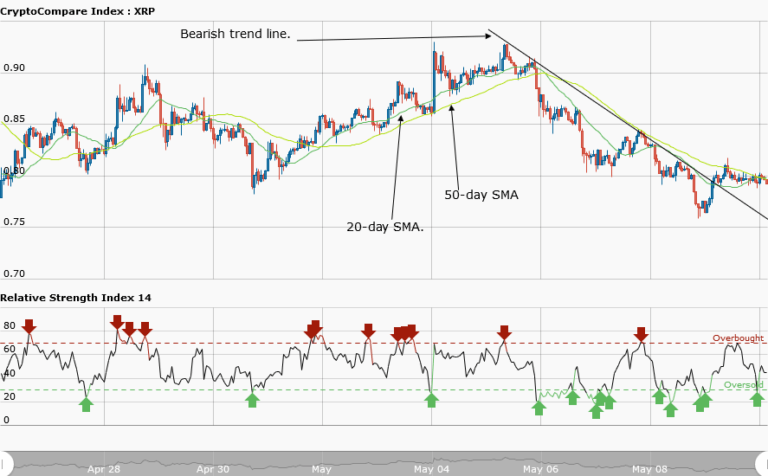
Nevertheless, the weekly chart shows that Ripple price rose to$0.81 but fell to $0.79 and commenced a range bound movement. Also, it broke the bearish trend line, thus ending the previous bullish trend. The asset is ranging horizontally at $0.79. Ripple price has to retest the $0.82 and $0.85 levels before it will reach $0.90.
Meanwhile, the relative strength index period 14 is level 44, which indicates that the asset price is in the range bound zone.
XRPUSD Short-term Trend: Ranging

The daily chart shows Ripple in a range-bound movement, between $0.79 and $0.80. This market is not good for a range-bound market strategy because of a short distance between the resistance level and the support level.
The views and opinions expressed here do not reflect that of CryptoGlobe.com and do not constitute financial advice. Always do your own research.