

LTCUSD Medium-term Trend:Bearish
Resistance: $165, $160, $155
Support: $135, $140, $145
The weekly chart shows that Litecoin has broken the support level at $160 and the asset is trading above the $150 level. A bearish trend line is drawn across the price bars showing the resistance levels where traders can short their trades. In a downtrend, we are expected to take short trades; therefore, as the price continues to fall, the pullbacks will touch the bearish trend line.
These are resistance levels where we can take short trades. If the price breaks the support level at $150 again, it will find support at $144.
LTCUSD Short-term Trend: Bearish

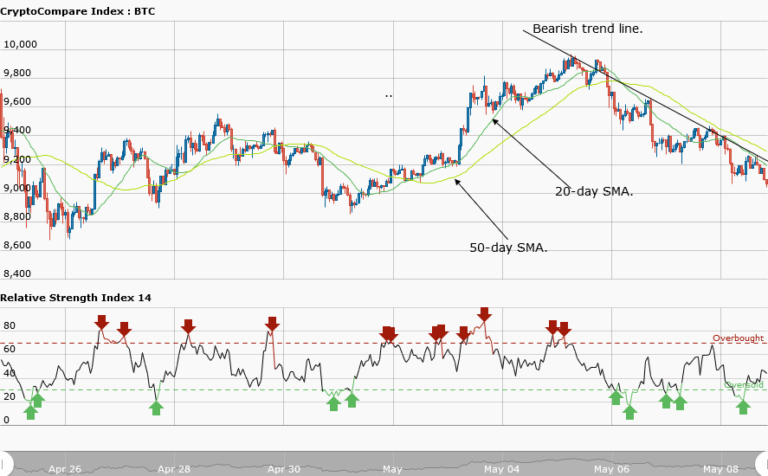
The daily chart shows Litecoin in a smooth downtrend. From $165, the asset moved in a systematic downward fall to $153. The 20-day and 50-day moving averages are trending southward.
The views and opinions expressed here do not reflect that of CryptoGlobe.com and do not constitute financial advice. Always do your own research.


