

LTCUSD Medium-term Trend: Ranging
Resistance: $166, $164, $162
Support: $154, $156, $158
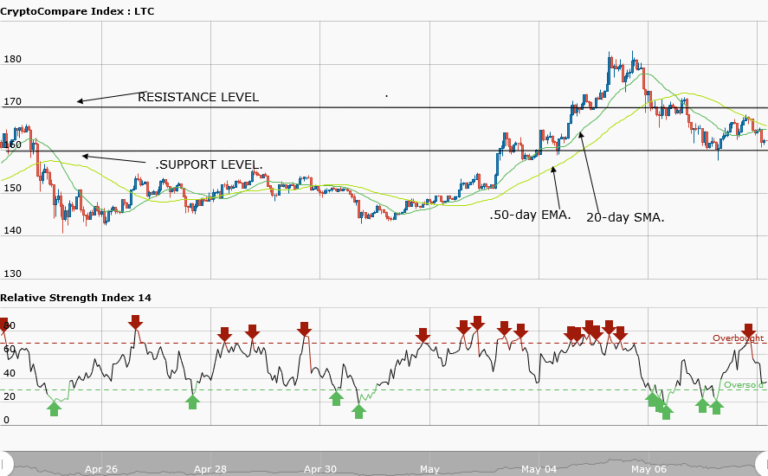
The price of Litecoin reached the high of $183 on May 5, but the resistance at that level brought the price to the low of $160. The asset also breaks the bullish trend line to end the previous trend. Today, the LTCUSD pair is trading at $160.19. However, the price of the asset is in a ranging market. The bearish breakouts at the levels of $183 and $172 brought the price to the low of $160. The price of Litecoin is ranging from the resistance level of $170 to the support level of $160.
The overall trend seems to be a downtrend. If the price of Litecoin breaks the support level at $160, Litecoin will find support at $150. On the other hand, if the price breaks the resistance level at $170, Litecoin will revisit the high at $183. Meanwhile, the relative strength index period 14 is level 52 which indicates that the price is in the range bound zone.
LTCUSD Short-term Trend: Ranging

In the daily chart, the price of Litecoin is ranging. The price of Litecoin fell to the low of $158 and it made a bullish movement to the highs of $166 and $168. At those levels, the price again fell to the low of $160.
The views and opinions expressed here do not reflect that of CryptoGlobe.com and do not constitute financial advice. Always do your own research


