

LTCUSD Medium-term Trend: Bearish
Resistance: $117, $116, $115
Support: $111, $112, $113
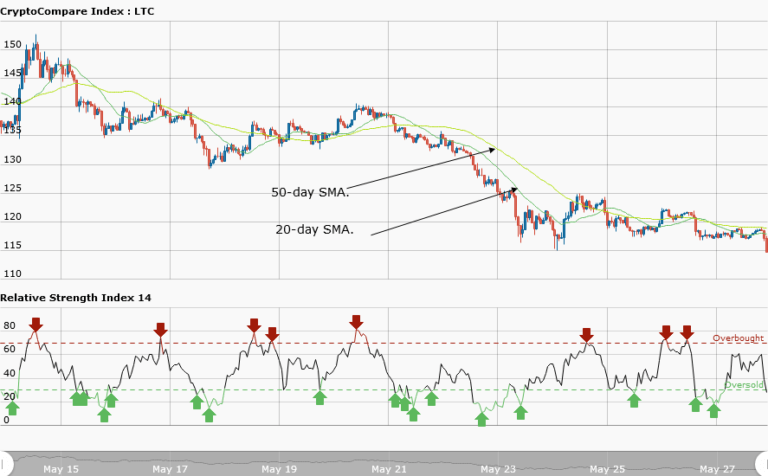
Last week, the LTCUSD pair was trading above the price of $100 all through the week. The price of Litecoin has a bearish outlook; the asset fell from the high of $138.49 to the low of $120.83. On May 23rd the price of Litecoin had a bearish breakout that broke the support level at $130. It was assumed that if the price broke the support level at $130, the asset would fall to the low of $115. However, the bearish pressure is ongoing.
Presently, Litecoin is trading at $113.49 as at the time of writing.Today, from the weekly chart, the price of Litecoin has fallen again from the high of $120 to the low of $110. THe price of the asset is likely is reach the low of $99 of December 7, 2017. Meanwhile, the relative strength index period 14 is level 27 indicates that the market is oversold – suggesting that bulls will take control of the market.
LTCUSD Short-term Trend: Bearish

On the daily chart, the price of Litecoin has a bearish outlook. The asset was ranging between the levels of $119 and $117 before it fell to the low of $114. The support levels will be breached if the downtrend continues.
The views and opinions expressed here do not reflect that of CryptoGlobe.com and do not constitute financial advice. Always do your own research.


