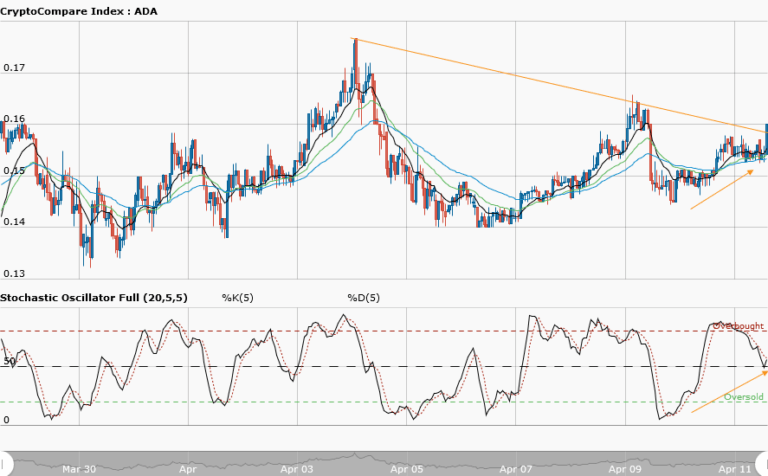
ADAUSD Medium-term Trend: Bearish
Supply zones: $0.4000, $0.4200, $0.4400
Demand zones: $0.1800, $0.1600, $0.1400
Cardano continues its bearish trend in the medium-term. Efforts by the bulls to push price high was minimal and it was constantly rejected by the bears.The bears increased their momentum and kept price below the $0.3200 supply area. Constant upward rejection is seen around the mowing averages especially the 50. Likewise, the daily candle opens below the 50 exponential moving average. These suggest strong bearish presence and pressure.
A bounce at the downward trendline could be seen with long bearish candles that took price back into the $0.3100 demand area. Stochastic oscillator is in the overbought region with it signal pointing down. This suggests strong downward momentum and price may be pushed further down by the bears as they intend to push price back to the $0.3000 demand zone in the medium term.
ADAUSD Short-term Trend: Ranging
Cardano returns to the range in the short-term. The struggle by both the bulls and the bears returns as price struggle between upper supply area at $03240 and lower demand area at $0.3050. Stochastic oscillator is in the overbought region, and may likely point downward which will means downward momentum.
Daily price candle opens at $0.3195 against yesterday $0.3241. This means more buyers are in the market and price may likely go down. Patience is therefore needed as Cardano returns to the range. Traders should wait for a breakout from the upper range to confirm the journey to the north or a breakdown from the lower price range for a further trend continuation to the south.
The views and opinions expressed here do not reflect that of CryptoGlobe.com and do not constitute financial advice. Always do your own research.


