
XRPUSD Medium-term Trend: Bearish
Supply Levels: $0.80, $0.75, $0.70
Demand levels: $0.50, $0.55 $0.60
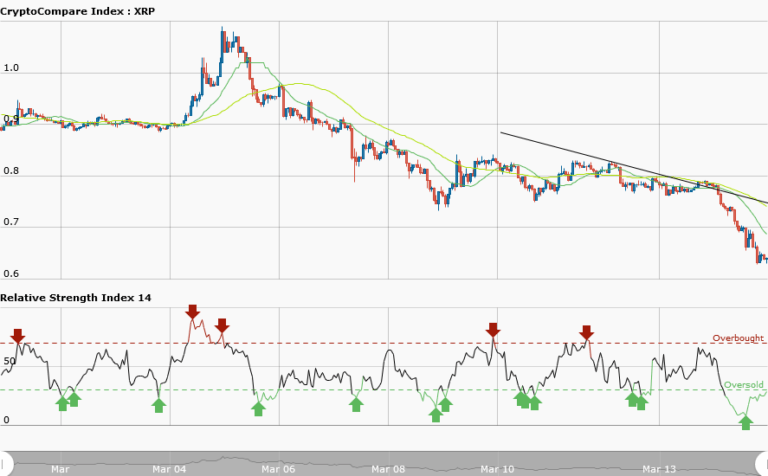
The Ripple price had tried to break the support level once without success after the selloff. Yesterday, it was assumed that if the price breaks the support level it will fall to as low as $0.60 but if it breaks the resistance level it will rally to the previous high of $0.90. Today the price of Ripple has fallen as a result of the breakout and it is currently trading at $0.64.
From the weekly chart, a bearish trend line is drawn showing the resistance levels where a trader can take a short trade. At the same time if the price retraces from the recent low and test the bearish trend line, a resistance will be created for a short trade. The current downtrend will be over if there is breakout at the bearish trend line.
Meanwhile, the RSI period 14 is level 28 which indicates that the market is oversold suggesting bulls taking over the market.
XRPUSD Short-term Trend: Bearish

The daily chart shows Ripple price in a smooth downtrend with a bearish trend line showing the resistance levels where traders can take short trades. However, the RSI period 14 is level 60 which indicates that the price is in the range market zone.