
Introduction
This report provides an analysis of XRP/USD based on the latest data as of 19 June 2023. The analysis includes a review of the current price, technical indicators, and moving averages.
Price and Volume Overview
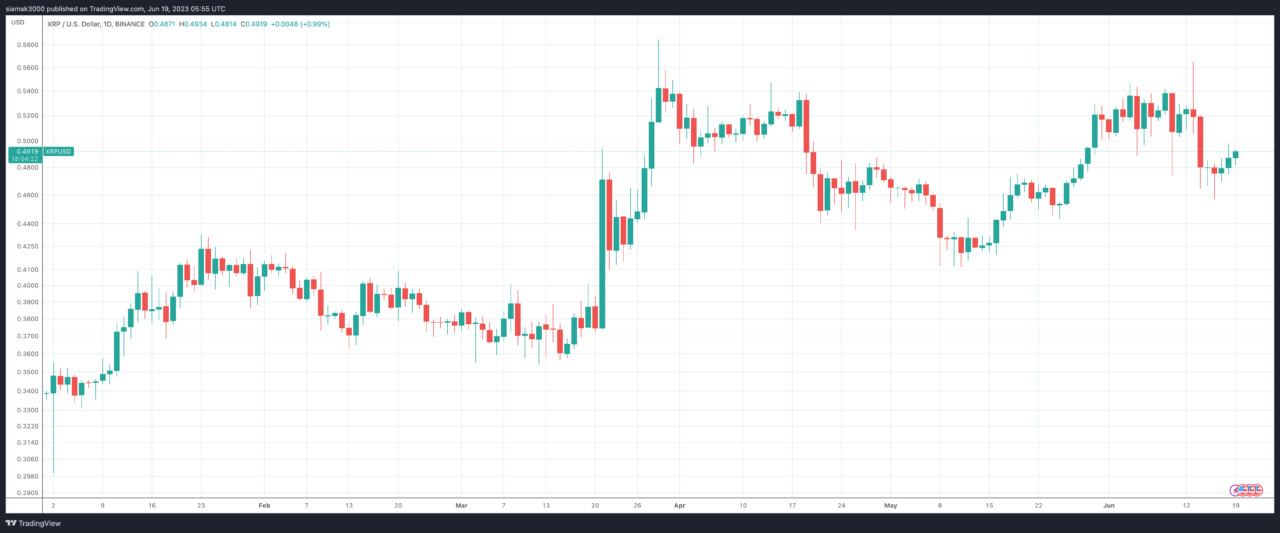
As of 4:49 a.m. UTC on 19 June 2023, on Binance, XRP is trading at $0.49240, up by $0.01140 (+2.37%) from the previous close. The volume stands at 260,045,761 XRP. The bid and ask prices are $0.49240 and $0.49250, respectively. The day’s range has been between $0.47850 and $0.49790.
Technical Indicators
Technical indicators are statistical tools traders and investors use to predict future price movements and market trends.
Here’s a detailed breakdown of the technical indicators for Ripple (XRP):
- RSI(14): The 14-day Relative Strength Index is 58.394, indicating a buy position. This suggests that the price momentum is currently favoring the buyers.
- STOCH(9,6): The Stochastic Oscillator is 43.766, indicating a sell position. This suggests that the price might be in a downward momentum.
- STOCHRSI(14): The Stochastic RSI is 44.305, indicating a sell position. This suggests that the price might be in a downward momentum.
- MACD(12,26): The Moving Average Convergence Divergence is 0.002, indicating a buy position. This suggests that the short-term momentum is stronger than the long-term momentum.
- ADX(14): The Average Directional Index is 28.049, indicating a buy position. This suggests that there is a moderate trend forming.
- Williams %R: The Williams %R is -41.781, indicating a buy position. This suggests that the market is not in an overbought or oversold condition.
- CCI(14): The Commodity Channel Index is 14.6184, indicating a neutral position. This suggests that the price is relatively stable.
- ATR(14): The Average True Range is 0.0041, indicating less volatility. This suggests that the price is not making large movements.
- Highs/Lows(14): The value is 0.0000, indicating a neutral position. This suggests that the price is relatively stable.
- Ultimate Oscillator: The value is 58.772, indicating a buy position. This suggests that the price momentum is currently favoring the buyers.
- ROC: The Rate of Change is -0.061, indicating a sell position. This suggests that the price might be in a downward momentum.
- Bull/Bear Power(13): The value is 0.0035, indicating a buy position. This suggests that the buyers are slightly more powerful than the sellers.
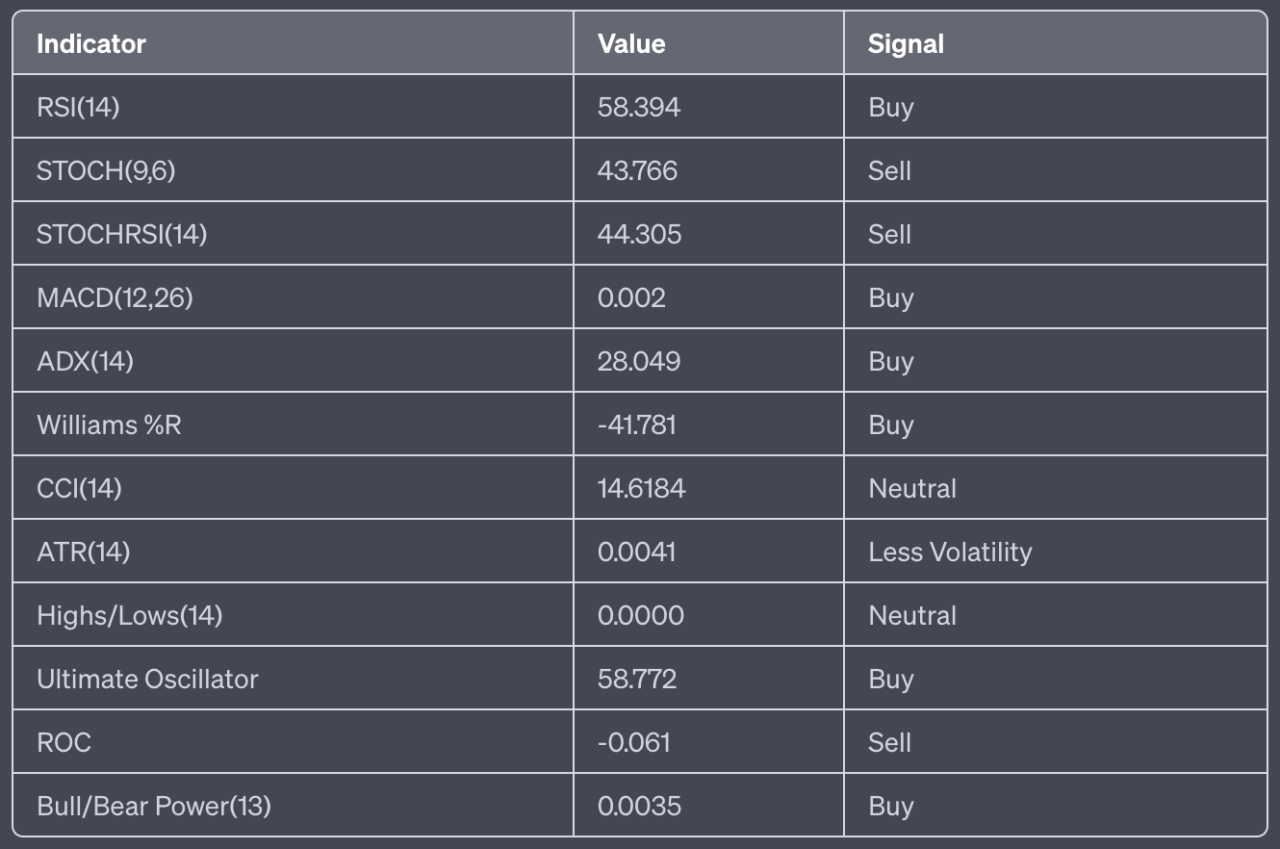
The technical indicators summary shows six buy signals, three sell signals, and two neutral signals, leading to a summary action of “STRONG BUY”.
Moving Averages
Moving averages are a type of data smoothing technique that analysts use in technical analysis to identify trends in a set of data, such as stock prices. They help to reduce the noise and fluctuation in price data to present a smoother line, making it easier to see the overall direction or trend.
There are several types of moving averages, but two of the most common ones are the Simple Moving Average (SMA) and the Exponential Moving Average (EMA).
- Simple Moving Average (SMA): The SMA is calculated by adding together the prices for a certain number of periods and then dividing by that number of periods. For example, a 5-day SMA would add together the closing prices for the last five days and then divide by five. The SMA gives equal weight to all the data points in its calculation.
- Exponential Moving Average (EMA): The EMA is similar to the SMA, but it gives more weight to recent data. This means it responds more quickly to recent price changes than the SMA. The calculation of the EMA is a bit more complex than the SMA, involving an exponential smoothing factor to give more weight to recent prices.
The significance of different period moving averages (like 5-day, 10-day, 20-day, 50-day, 100-day, and 200-day) lies in the timeframe that traders are interested in:
- 5-day, 10-day, and 20-day moving averages are often used for short-term trends. They respond quickly to price changes and are useful for traders looking to take advantage of short-term price movements.
- 50-day and 100-day moving averages are more medium-term. They are less sensitive to daily price fluctuations and provide a clearer picture of the medium-term trend.
- 200-day moving average is a long-term trend indicator. It’s less sensitive to daily price fluctuations and provides a clearer picture of the long-term trend. Many traders consider a market to be in a long-term uptrend when the price is above the 200-day moving average and in a long-term downtrend when it’s below.
It’s important to note that moving averages are lagging indicators, meaning they are based on past prices. They can help identify a trend but won’t predict future price movements.
Here’s a detailed breakdown of the moving averages for XRP:
- MA5: The 5-day SMA is $0.48970, and the 5-day EMA is $0.49035, both indicating a buy position. This suggests that the price is currently above the average of the past 5 days.
- MA10: The 10-day SMA is $0.48954, and the 10-day EMA is $0.48987, both indicating a buy position. This suggests that the price is currently above the average of the past 10 days.
- MA20: The 20-day SMA is $0.49003, and the 20-day EMA is $0.48867, both indicating a buy position. This suggests that the price is currently above the average of the past 20 days.
- MA50: The 50-day SMA is $0.48403, and the 50-day EMA is $0.48500, both indicating a buy position. This suggests that the price is currently above the average of the past 50 days.
- MA100: The 100-day SMA is $0.47963, and the 100-day EMA is $0.48671, both indicating a buy position. This suggests that the price is currently above the average of the past 100 days.
- MA200: The 200-day SMA is $0.49669, and the 200-day EMA is $0.49375, both indicating a sell position. This suggests that the price is currently below the average of the past 200 days.
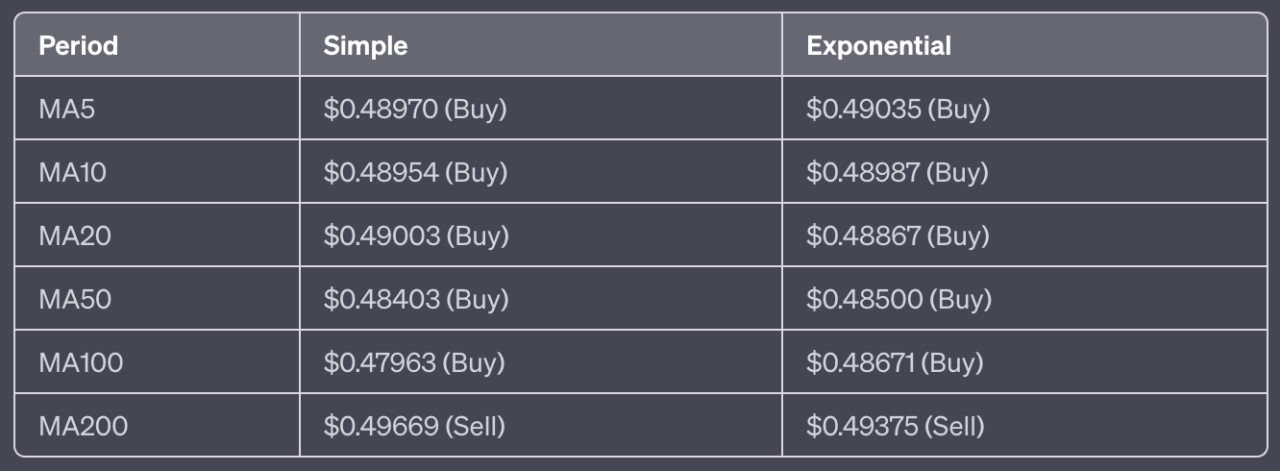
The moving averages summary shows ten buy signals and two sell signals, leading to a summary action of “STRONG BUY”.
Conclusion
The market conditions for XRP as of 19 June 2023 show strong signs of a bullish trend. The technical indicators and moving averages predominantly signal a “buy” action, indicating a potential upward movement in the price of XRP.
The technical indicators show six “buy” signals, three “sell” signals, and two “neutral” signals. Notably, the RSI(14) and the Ultimate Oscillator indicate a “buy” position, suggesting that the price momentum is currently favoring the buyers. However, the STOCH(9,6) and STOCHRSI(14) are both indicating a “sell” position, suggesting a potential short-term downward momentum. This could mean that there might be some price corrections before the upward trend continues.
The moving averages further strengthen the “buy” signal, with ten “buy” signals and only two “sell” signals. The 5-day, 10-day, 20-day, 50-day, and 100-day SMAs and EMAs all indicate a “buy” position, suggesting that the price is currently above the average of the past 5, 10, 20, 50, and 100 days. However, the 200-day SMA and EMA indicate a “sell” position, suggesting that the price is below the average of the past 200 days. This could mean that while the short-term trend is bullish, the long-term trend is still bearish.
The ATR(14) indicates less volatility, suggesting that the price is not making large movements. This could mean that the price changes might be gradual, and any upward or downward movements might not be drastic.
In conclusion, while the market conditions are currently favorable for buying, traders and investors should still exercise caution. The mixed signals from the technical indicators suggest that there might be some price corrections in the short term. Furthermore, the less volatility indicated by the ATR(14) means that any price changes might be gradual.
As always, while technical analysis tools can provide useful insights, they are not a guarantee of future performance, and all trading strategies should be used in conjunction with other market information and individual research.
Featured Image Credit: Photo / illustration by “Dylan Calluy” via Unsplash