
Introduction
This comprehensive report analyzes Ethereum’s price dynamics on Binance, covering technical indicators, moving averages, and pivot points.
Price and Volume Snapshot
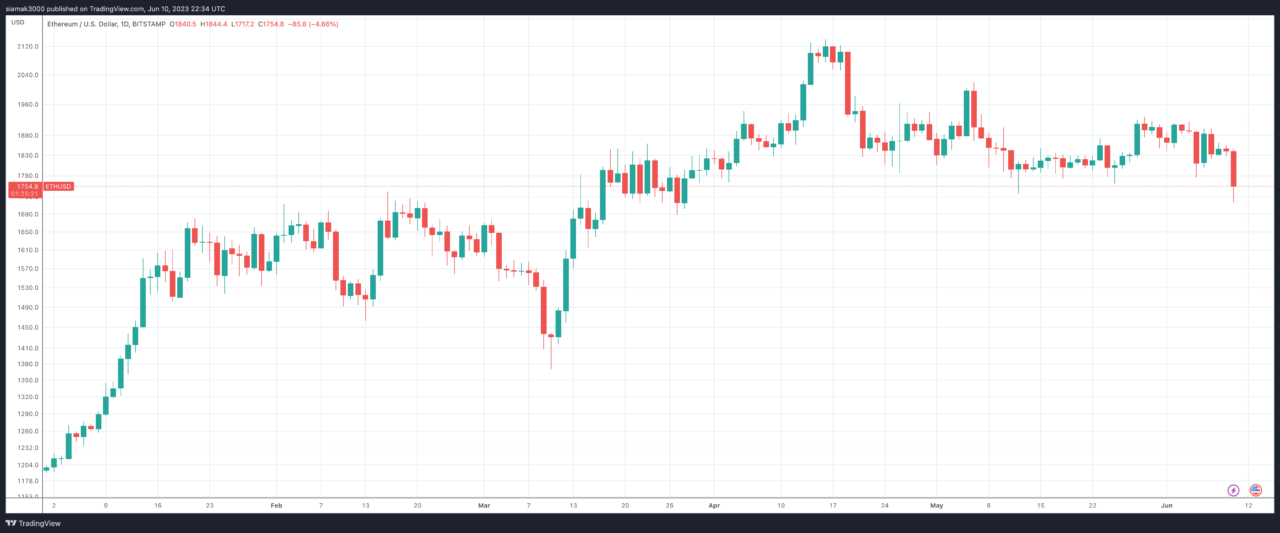
At the time of the report, Ethereum (ETH) was priced at $1,744.79, experiencing a decrease of $92.07 (-5.01%) compared to the previous period. The snapshot was taken at 21:56:06 UTC, with a trading volume of 646,759 units on Binance.
Technical Indicators Analysis
The RSI (14) is at 38.383, which is below the typical mid-point of 50, suggesting that Ethereum is potentially oversold. The STOCH (9,6) is at 38.050, which also suggests that the asset may be oversold. The STOCHRSI (14) is at 89.480, which is in the overbought territory, suggesting a potential price reversal. The MACD (12,26) is at -18.050, indicating a bearish trend as the MACD line is below the signal line. The ADX (14) is at 30.569, which is above 25, indicating a strong trend, but it’s neutral as it doesn’t indicate the direction of the trend. The Williams %R is at -50.765, which is near the mid-point, suggesting a lack of clear direction in the market. The CCI (14) is at 48.0310, which is near the zero line, suggesting a lack of momentum. The ATR (14) is at 13.0657, suggesting less volatility. The Highs/Lows (14) is at 0.0000, indicating a neutral market. The Ultimate Oscillator is at 52.670, suggesting bullish momentum. The ROC is at 0.769, which also suggests bullish momentum. However, the Bull/Bear Power (13) is at -17.6740, suggesting bearish momentum. Overall, the technical indicators suggest a bearish trend with some signs of potential bullish reversal.
Moving Averages Analysis
The Simple Moving Averages (SMA) and Exponential Moving Averages (EMA) for the 5-day and 10-day periods are mixed, with the 5D SMA suggesting a sell and the 5D and 10D EMA suggesting a buy. This indicates a potential trend reversal. However, the SMA and EMA for the 20-day, 50-day, 100-day, and 200-day periods are all suggesting a sell, indicating a bearish trend. Overall, the moving averages suggest a bearish trend with some signs of potential bullish reversal in the short term.
Pivot Points Analysis
The pivot points suggest potential support and resistance levels. For the Classic pivot points, the pivot point is at 1742.74, with support levels at 1738.80 (S1), 1734.79 (S2), and 1730.85 (S3), and resistance levels at 1746.75 (R1), 1750.69 (R2), and 1754.70 (R3).
The Fibonacci pivot points suggest a pivot point at 1742.74, with support levels at 1739.70 (S1) and 1737.83 (S2), and resistance levels at 1745.78 (R1) and 1747.65 (R2). Fibonacci pivot points do not typically include a third level of support and resistance.
The Camarilla pivot points indicate a pivot point at 1742.74, with support levels at 1742.07 (S1), 1741.34 (S2), and 1740.61 (S3), and resistance levels at 1743.53 (R1), 1744.26 (R2), and 1744.99 (R3).
For the Woodie’s pivot points, the pivot point is at 1742.75, with support levels at 1738.82 (S1), 1734.80 (S2), and 1730.87 (S3), and resistance levels at 1746.77 (R1), 1750.70 (R2), and 1754.72 (R3).
The DeMark’s pivot points suggest a potential resistance level at 1744.74 and a potential support level at 1736.79. DeMark’s pivot points do not typically include a third level of support and resistance.
These levels indicate a narrow trading range, suggesting that the market is waiting for a catalyst to determine the next direction. Traders could use these levels to identify potential entry and exit points.
Conclusion
The comprehensive analysis of Ethereum’s price dynamics on the Binance exchange reveals a bearish trend in the market, as suggested by the majority of the technical indicators and moving averages. However, there are some signs of potential bullish reversal, particularly in the short term, as indicated by the 5-day and 10-day moving averages and some of the technical indicators, such as the Ultimate Oscillator and ROC.
The pivot points analysis provides potential support and resistance levels, which traders can use to identify potential entry and exit points. The narrow trading range suggested by these levels indicates that the market is waiting for a catalyst to determine the next direction.
While the analysis provides valuable insights into the potential price trends, it is crucial for traders and investors to conduct additional research and consider multiple factors before making investment decisions. This is because the analysis is based on historical data and does not guarantee future price movements. The volatile nature of the cryptocurrency market also necessitates a cautious approach to trading and investing.
Featured Image Credit: Photo / illustration by “Dylan Calluy” via Unsplash