TRXUSD Long-term Trend – Ranging
- Distribution territories: $0.04, $0.045, $0.05
- Accumulation territories: $0.02, $0.015, $0.01
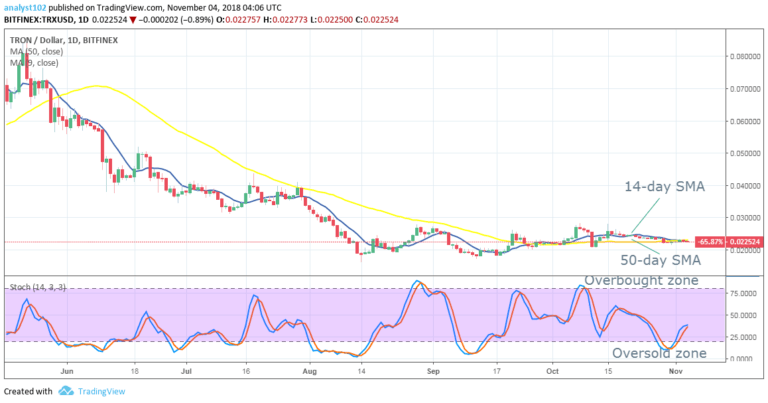
The TRXUSD market has resorted to featuring a chain of range price movements after an April 11 decline. The market weakly averaged a trade point at $0.025 on the following day, April 12, and since then, there has been an occurrence of the range movements.

Yet, the crypto-trade shows variant lower lows closely under the sell trend-line of the 14-day SMA within $0.03 and $0.025 marks. The 50-day SMA is now located very tightly to the $0.025 mark closer below the 14-day SMA. The Stochastic Oscillators are still bent southward. And, they have touched range 20. The TRXUSD pair still appears to feature more variant range trade movements around its SMAs in the next trading sessions. The bears are no more expected to largely bring down the market point far below the 50-day SMA. In light of nursing that sentiment, the bulls may have to wait for a strong buy signal which may emerge around the $0.025 price point.
The views and opinions expressed here do not reflect that of CryptoGlobe.com and do not constitute financial advice. Always do your own research.