

LTCUSD Medium-term Trend: Bullish
- Resistance Levels: $60, $65, $70
- Support Levels: $60, $50, $40
The LTCUSD pair had been on a downward trend since April 6. The downward trend was as a result of the inability of the bulls to break the $96 resistance level. On April 11, the crypto’s price fell to the support of the 26-day EMA. On April 11, the price fell to a low at $79.65. The price of Litecoin now consolidates above the $70 price level.
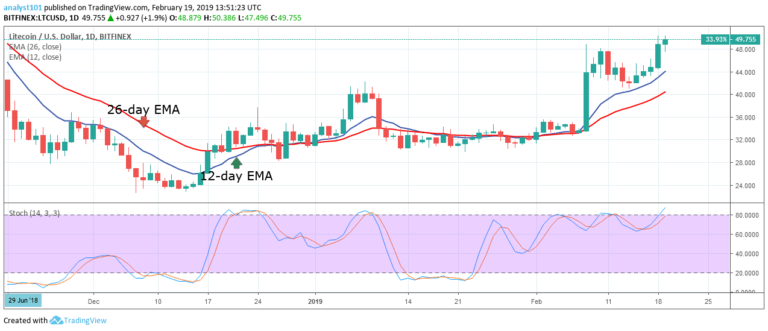
On the upside, if the 26-day EMA support level holds, the crypto’s price will resume its bullish trend to retest the $96 resistance level. On the downside, if the bears break below the EMAs, the crypto’s price will fall to the previous low at $65. Meanwhile, the stochastic is in the overbought region but below the 60% range which indicates that the crypto is in bearish momentum and a sell signal.
LTCUSD Short-term Trend: Bearish

On the 4-hour chart, the price of Litecoin is in a bearish trend. The crypto’s price fall was in a systematic downward fall. On April 6, the bulls tested the $96 resistance level, and the price fell to the support of EMAs at the $87.36 price level. At the low of $87.36, the crypto’s price now ranges above the EMAs to test the $92 resistance level.
The resistance made the crypto’s price to fall to another low at $77.85. This has been the scenario in the last two weeks. Today, the crypto’s price is in a bullish trend and may face resistance at the $80 price level. This will further depreciate the crypto’s price. Meanwhile, the stochastic is in the oversold region but above the 20% range which indicates that the crypto is in a bullish momentum and a buy signal.
The views and opinions expressed here do not reflect that of CryptoGlobe.com and do not constitute financial advice. Always do your own research.


