
ETHUSD Long-term Trend – Bullish
- Distribution territories: $190, $200, $210
- Accumulation territories: $120, $110, $100
Ethereum’s price has been rising against the US dollar in the last few trading sessions of the week. The cryptocurrency is, however, still trading within the boundaries of a specific range.

On April 2, the cryptocurrency surged from its position at the $140 mark to test a $180 high on the following day. Ethereum receded to touch the $150 line, where it then bounced back. The 14-day SMA is located over the 50-day SMA.
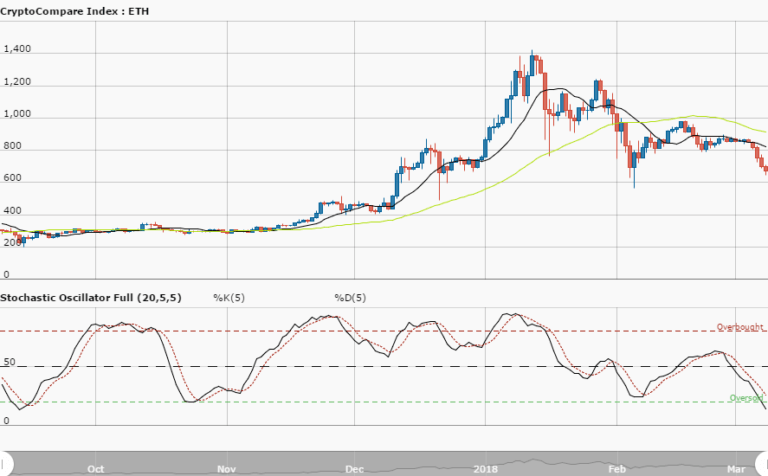
The Stochastic Oscillators have crossed within the ranges 80 and 60 and are pointing south. The market’s bullish sentiment could be maintained, as the 14-day SMA won’t easily be broken downwards.
A breakout above the $180 mark could soon lead to a trend reversal, leading to a bearish trend.
The views and opinions expressed here do not reflect that of CryptoGlobe.com and do not constitute financial advice. Always do your own research.


