

ETHUSD Medium-term Trend: Ranging
- Resistance Levels: $230, $240, $250
- Support Levels: $130, $120, $110
Since February 23, the price of Ethereum has been in a range bound movement. After the bulls were resisted at the $160 level, the crypto’s price fell to a low of $135.30. The bulls manage to go over the $140 resistance but were soon repelled. It was the fifth time they tested the $140 resistance, without breaking it.
The price fell below its EMAs. A breakout above $140 could see Ethereum’s price hit $160.Its Stochastic indicator is out of the oversold region, above range 20. It’s blue line is making a U-turn indicating bullish momentum.
ETHUSD Short-term Trend: Bullish

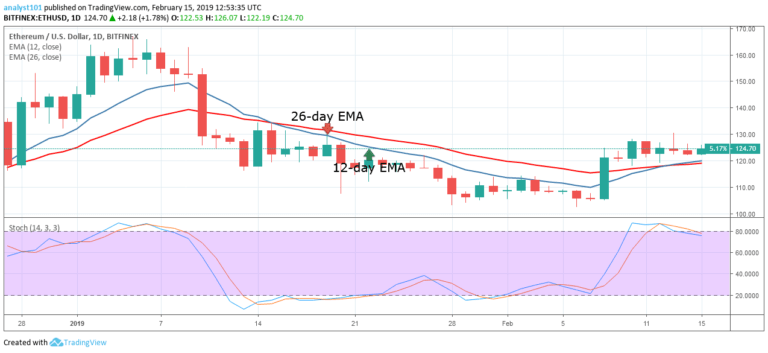
On the 4-hour chart, the price of Ethereum is in a bullish trend. On March 20, the bulls reached a high of $143.02 but faced resistance. The crypto’s price then fell to a low of $137 and entered a range bound movement below its EMAs. Today, the bulls have broken the 12-day EMA and the 26-day EMA.
If ETH’s price remains above its EMAs, the bulls are likely going to manage to break its current resistance. The Stochastic Oscillators are in the overbought region above 80, indicating the price is in a bullish trend, and being a buy signal.
The views and opinions expressed here do not reflect that of CryptoGlobe.com and do not constitute financial advice. Always do your own research.


