
BTCUSD Long-term Trend – Ranging
- Distribution territories: $4,500, $5,000, $5,500
- Accumulation territories: $2,500, $2,000, $1,500
Bitcoin’s price has recently gone up over the $4,000 mark, on February 23. On February 24, the cryptocurrency dropped below said point, and then kept on moving along its 14-day SMA trendline until now.

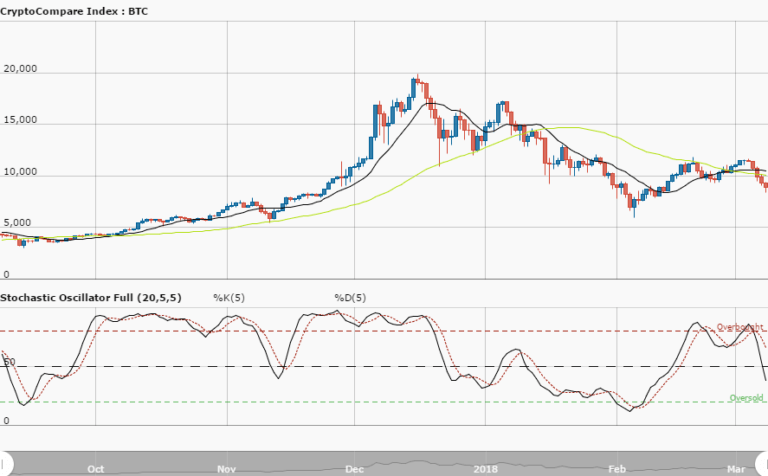
Bitcoin’s 14-day SMA is over its 50-day SMA, within the $4,000 and $3,500 marks. The Stochastic Oscillators are at about range 40, pointing towards strong consolidation movements in the future.
To get BTC on a downward trend, the bears have to be able to violently break through the $3,500 support. If that happens, Bitcoin will start trading between the $3,500 and $2,500 marks. Traders can be on the lookout for a breakout over its current range.
The views and opinions expressed here do not reflect that of CryptoGlobe.com and do not constitute financial advice. Always do your own research.


