

XMRUSD Medium-term Trend: Ranging
- Supply zones: $120, $130, $140
- Demand zones: $ 40, $30, $20
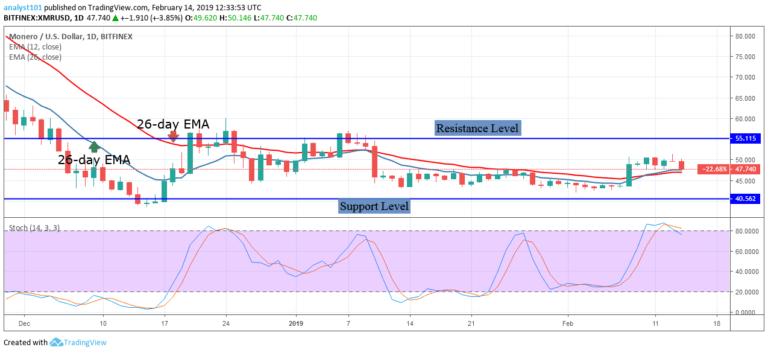
The price of Monero is now in the bullish trend zone within the range-bound levels of $40 and $55. On January 10, the bears broke below the 12-day EMA, the 26-day EMA and the crypto fell into the bearish trend zone. On February 8, the bulls broke above the EMAs, as the crypto fell into the bullish trend zone. In the bearish trend zone, the crypto traded below the EMAs.
Whereas in the bullish trend zone, the crypto’s price is expected to trade above the EMAs and price is likely to rise. On February 8, the crypto’s price reached a high of $48.95. Later the crypto’s price reached another high of $55.57 and was resisted. The price of Monero is in the bullish trend zone and it is facing resistance at the $50 price level.
The crypto is trading at $48.24 as at the time of writing. The bulls have to break the resistance at $50 for the crypto’s price to reach the highs of $55 and $60. On the other hand, the crypto may fall, if the bears break below the EMAs. Meanwhile, the Stochastic is in the overbought region below the 80% range. This indicates that the price is in a bearish momentum and a sell signal.
XMRUSD Short-term Trend: Bearish

On the 4-hour chart, the price of Monero is in a bearish trend. On February 8, the crypto had a price breakout as price reached a high of $49.03. Since then the crypto has been in the bullish trend zone. On February 13, the bears broke the EMAs and price fell to the low of $48. The crypto is likely to fall as the price is in the bearish trend zone.
Meanwhile, the Stochastic is in the oversold region and below the 20% range. This indicates that the price is in a strong bearish momentum and a sell signal.
The views and opinions expressed here do not reflect that of CryptoGlobe.com and do not constitute financial advice. Always do your own research.


