

BTCUSD Medium-term Trend: Bearish
- Resistance levels: $7,000, $7,200, $7,400
- Support levels: $3,500, $3,300, $3,100
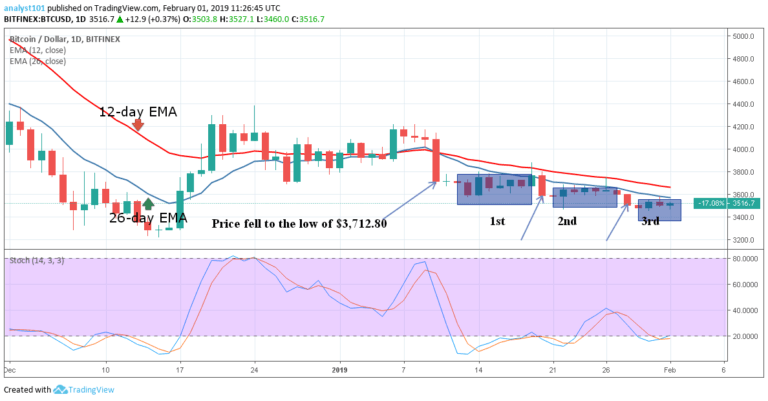
From the daily chart view, the price of Bitcoin is in a bearish trend zone. On January 10, the bearish trend zone was declared when the bears broke the 12-day EMA, the 26-day EMA and the crypto fell to the low of $3,712.80. Then from the daily chart, you can see find the first, second and third rectangular blocks of price bars in a range bound movement.
From the price action, the crypto commenced a range bound movement and was resisted by the 12-day EMA. Then the crypto’s price would depreciate further. This has been the scenario since January 10. On the downside, after the third rectangular block of price bars, the crypto is likely to find support at the lows of either $3,000 or $3,200. Meanwhile, the stochastic is in the oversold region but below the 20% range, which indicates that the price is in a bearish momentum and a sell signal.
BTC/USD Short-term Trend: Bearish

On the 4-hour chart, the price of Bitcoin is in a bearish trend zone. On January 31, the bears broke the 12-day EMA , the 26-day EMA and the crypto fell to the low of $3,498.9. Today, the crypto’s price was resisted as the price fell to the low of $3,470.80. The Stochastic is out of the overbought range but below the 40% range which indicates that the price is in a bearish momentum and a sell signal.
The views and opinions expressed here do not reflect that of CryptoGlobe.com and do not constitute financial advice. Always do your own research.


