

XMRUSD Medium-term Trend: Ranging
- Supply zones: $120, $130, $140
- Demand zones: $ 40, $30, $20
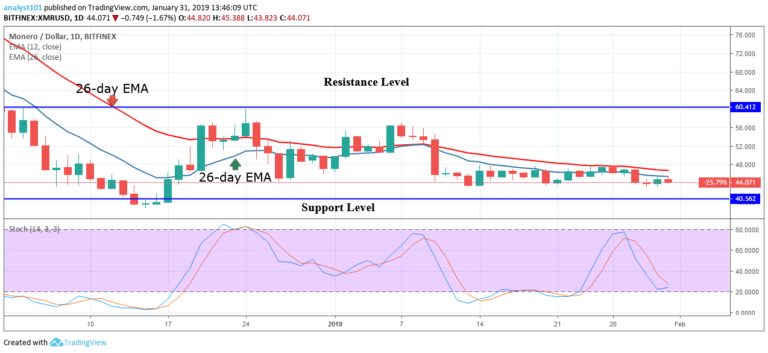
The price of Monero had been trading in the bearish trend zone in the last three weeks. The crypto had been trading below the $46 price level. The 12-day EMA and the 26-day EMA are horizontally flat indicating that the price is in a range bound movement. The crypto’s price is either resisted by the 12-day EMA or 26-day EMA.
On the upside, if the bulls break above the EMAs, the crypto will reach the highs of $50 and $ 60. On the downside, if the bears continue its downward fall, the crypto will sink to the lows of $40 and $43. Meanwhile, the stochastic is below the 40% range which indicates that the price is in a bearish momentum and a sell signal.
XMRUSD Short-term Trend: Ranging

On the 1- hour chart, the price of Monero is in a bearish trend zone. Yesterday, the price of Monero was in the bullish trend zone as the crypto reached the high of $45.38. Today, the bears broke the 12-day EMA and the 26-day EMA as the price fell to the low of $44.41. The price fall was a result of the resistance at the $45 price level.
The crypto’s price is below the EMAs which indicates that the crypto is likely to depreciate. On the downside, if the crypto’s price falls, it will fall to the low of $43. The $43 price level had been holding since January 13, 2019. Traders should initiate long trades if the crypto falls to this level. Meanwhile, the stochastic is in the oversold region but below the 20% range which indicates that the price is in a strong bearish momentum and a sell signal.
The views and opinions expressed here do not reflect that of CryptoGlobe.com and do not constitute financial advice. Always do your own research.


