
 Ethereum Chart By Trading View
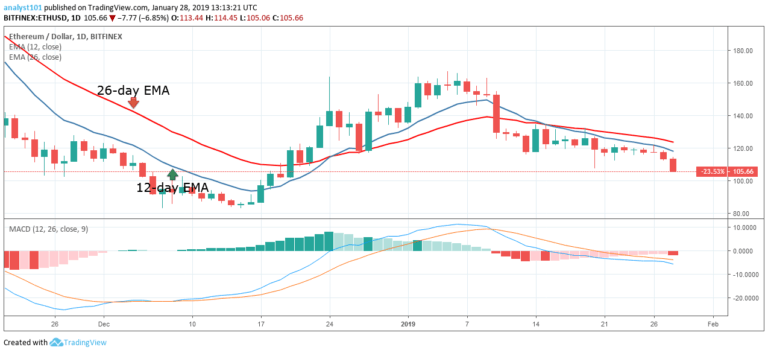
ETHUSD Medium-term Trend: Bearish
- Resistance Levels: $230, $240, $250
- Support Levels: $110, $100, $90
Last week the ETHUSD pair was trading in the bearish trend zone. The crypto’s price was trading below the 12-day EMA and the 26-day EMA. In the previous week, the crypto’s price was trading below the $120 price level, as the 12-day EMA provides resistance to the crypto’s price. Today, the ETH price has fallen to the low of $105 price level.
There is the likelihood of the price falling because the crypto’s price is below the EMAs. Nevertheless, the $100 support level is a critical level for the price of Ethereum. On the downside, if the bears break the $100 price level, the crypto will find support at the $85 price level. On the upside, if the $100 price level is unbroken, traders should look out for buy setups to initiate long trades.
Meanwhile, the MACD line and the signal line are below the zero line which indicates a sell signal.
ETHUSD Short-term Trend: Bearish
 Ethereum Chart By Trading View
On the 4-hour chart, the price of Ethereum is in a bearish trend zone. Last week, the ETH price was trading below the 12-day EMA and the 26-day EMA. Meanwhile, the 12-day EMA and the 26-day EMA provides resistance to the crypto’s price. Also, in the last 24 hours, a bearish candlestick tested the 12-day EMA and was resisted, the ETH price has since been falling to the $100 price level.
Today, the ETH price has reached the low of $105 as at the time of writing. Meanwhile, the stochastic indicator is in the oversold region but below the 20% range which indicates that the ETH price is in a strong bearish momentum and a sell signal.
The views and opinions expressed here do not reflect that of CryptoGlobe.com and do not constitute financial advice. Always do your own research.


