
 Ethereum Chart By Trading View
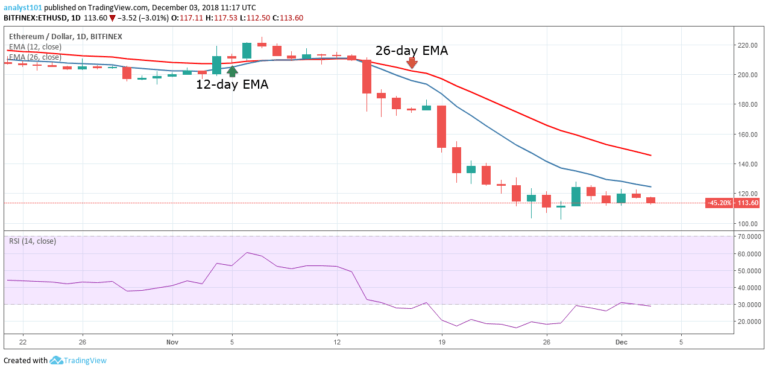
ETHUSD Medium-term Trend: Bearish
Resistance Levels: $230, $240, $250
Support Levels: $100, $90, $80
Last week the price of Ethereum was in a bearish trend. The crypto’s price fell to a low of $110.75. The digital currency had been fluctuating above the $110 price level, with a Doji other small candlesticks describing the indecision between buyers and sellers at the $110 price level.
Also, since on November 25, the digital currency had been range-bound between the levels of $100 and $130 as shown in the chart below. Ethereum is currently below the 12-day EMA and the 26-day EMA indicating that it’s in a bearish trend.
In addition, the Relative Strength Index period 14 is level 28 which indicates that price has reached an oversold region, suggesting bulls may take control. A long trade is not recommended as the price is in a bearish trend.
ETHUSD Short-term Trend: Ranging
 Ethereum Chart By Trading View
On the short-term trend, the price of Ethereum is in a sideways trend. Currently, it is below the $110 price level. The crypto is expected to find support at $100 price level.If the bulls take control of the price, the digital currency will face resistance at the $130 price level.
The views and opinions expressed here do not reflect that of CryptoGlobe.com and do not constitute financial advice. Always do your own research.


