
ETHUSD Long-term Trend – Bullish
- Distribution territories: $180, $200, $220
- Accumulation territories: $60, $40, $20
Last week Ethereum’s price was moving upward against the US dollar, and that has seen it hit the $160 mark on December 24. As a result, the cryptocurrency ended up facing a correction that took it down to $140, and later on dropped to an area close to its 14-day SMA, on December 27.

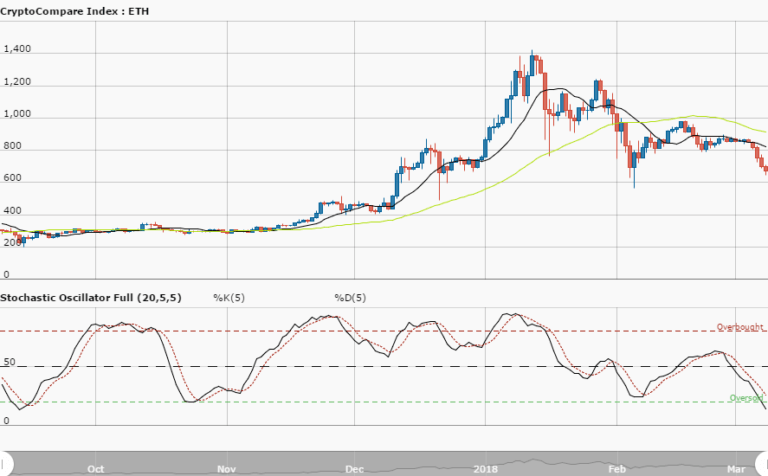
The cryptocurrency currently appears to be finding support at the 14-day SMA, and has recently breached the 50-day SMA which could see it enter another bullish trend. The 14-day SMA is bent northwards, below the 50-day SMA.
The Stochastic Oscillators have crossed at range 60, and are now seemingly attempting to start a consolidation movement around it. This suggests that further trading may be suspended for a while. If ETH sees a bullish movement get rejected at $160, it can expect to go down to $140 or even $100.
The views and opinions expressed here do not reflect that of CryptoGlobe.com and do not constitute financial advice. Always do your own research.


