

BTCUSD Medium-term Trend: Bullish
- Resistance levels: $7,000, $7,200, $7,400
- Support levels: $3,900, $3,700, $3,500
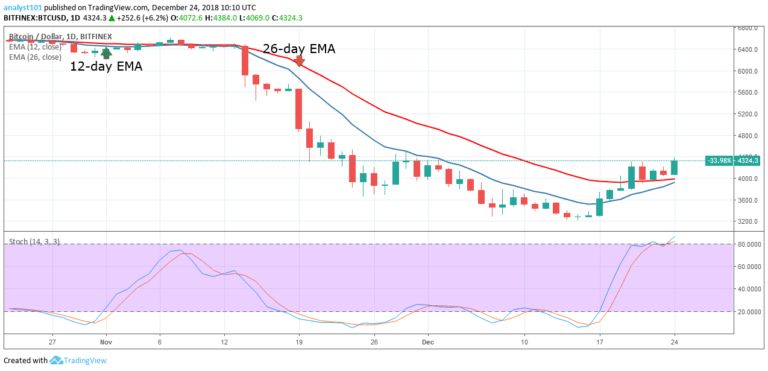
In the last week, the BTCUSD pair was in a bullish trend as price broke upward above the $3,300 price level. The BTC price also broke the 12-day EMA and the 26-day EMA to the upside as the price enters the bullish trend zone. The crypto’s price has also broke the resistance at the $4,000 and $4,200 price levels as the price approaches the $4,500 resistance level.
From the daily chart, the blue band of Stochastic is above the red band indicating a buy signal. As the Stochastic enters the overbought region above the 80% range, it indicates that price of Bitcoin is in a strong bullish momentum. In the same vein, if the bulls break the $4,500 resistance level, the crypto will reach the highs of $5,000 and $5,500.
On the other hand, if the crypto’s price fails to break the $4,500, Bitcoin will commence a range bound movement.
BTCUSD Short-term Trend: Bullish

On the 4-hour chart, the crypto’s price is in a bullish trend. The bullish trend is ongoing as it trends on the 12-day EMA as a support level. Today, the crypto’s price reaches the high of $4,380 price level. The price is retracing from the recent high as it tests the resistance zone. Meanwhile, the Relative Strength Index period 14 is level 63 which indicates that the price is in the bullish trend zone.
The crypto’s price is expected to rise after the retracement. Traders are expected to initiate long trades after the retracement in anticipation of a bullish trend.
The views and opinions expressed here do not reflect that of CryptoGlobe.com and do not constitute financial advice. Always do your own research.


