
 Ethereum Chart By Trading View
ETHUSD Medium-term Trend: Bearish
Resistance Levels: $200, $220, $240
Support Levels: $180, $160, $140
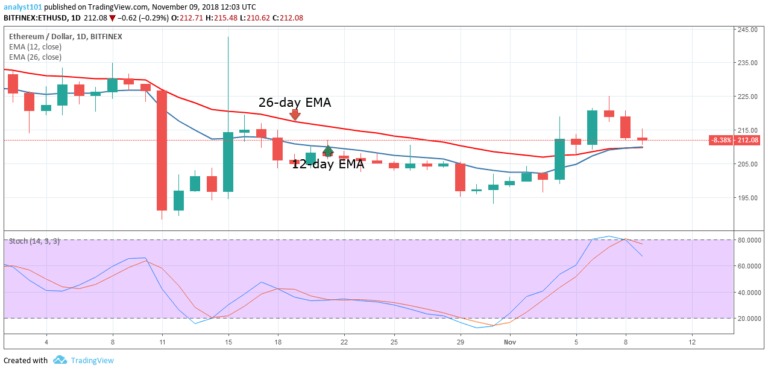
Yesterday, the price of Ethereum was in a bearish trend. The crypto was resisted because Ethereum faced resistance at the price of $220. The crypto’s price is approaching the 12-day EMA and the 26-day EMA. If the price breaks the EMAs, the crypto will find support at $200. In addition, the stochastic indicator is below 80 which indicates a sell signal and the momentum is on the downward side.
Meanwhile, the price of Ethereum is above the 12-day EMA and the 26-day EMA which indicates that it is in the bullish trend zone.
ETHUSD Short-term Trend: Bearish
 Ethereum Chart By Trading View
On the short-term trend, the price of Ethereum is in a bearish trend. The crypto’s price is below the 12-day EMA and the 26-day EMA which indicates that the price is in the bearish trend zone. In addition, the Stochastic is below 20 which indicates that the price is in the oversold region. It also means that the momentum is strong and that an oversold market has a high chance of going down.
Traders can stick to their short positions until the market reverses.
The views and opinions expressed here do not reflect that of CryptoGlobe.com and do not constitute financial advice. Always do your own research.


