
 Ethereum Chart By Trading View
ETHUSD Medium-term Trend: Bearish
Resistance Levels: $230, $240, $250
Support Levels: $120, $100, $80
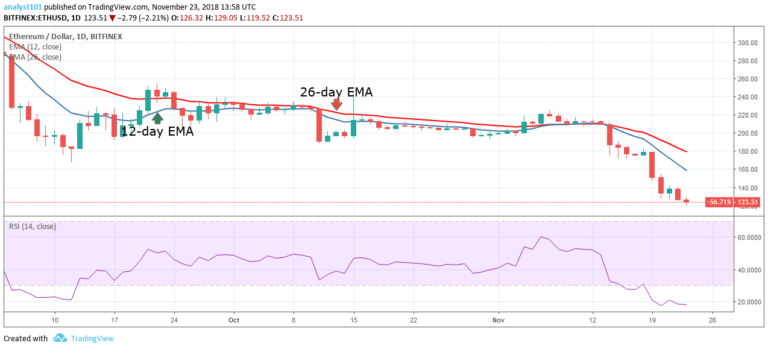
On November 22, the price of Ethereum was in a bearish trend. Yesterday, the digital currency was trading at a price of $126.30. The crypto’s price is below the 12-day EMA and the 26-day EMA which indicates that price is likely to fall. If price falls below the $126 without a pullback, the digital currency is likely to further depreciate.
In other words, the crypto is likely to fall to the lows of $110 or $115 as the crypto is within the bearish trend zone. Meanwhile, the Relative Strength Index period 14 is level 17 which indicates that price has reached the oversold region of the market suggesting bulls to take control of the market. There will be no trade recommendation until the bearish pressure is exhausted and we look out for buy setups.
ETHUSD Short-term Trend: Bearish
 Ethereum Chart By Trading View
On the short-term trend, the price of Ethereum is in a bearish trend. The crypto’s price is below the 12-day EMA and the 26-day EMA which indicates that price has the tendency to fall. Meanwhile, the Stochastic is in the range above 20 which indicates a buy signal as the blue band of the Stochastic is above the red band.
The views and opinions expressed here do not reflect that of CryptoGlobe.com and do not constitute financial advice. Always do your own research. .


