ETHUSD Long-term Trend – Ranging
Distribution territories: $250, $350, $450.
Accumulation territories: $150, $100, $50.
On November 7, Ethereum saw its price fall against the US dollar that included it featuring lower lows within the range between $220 and $200. The range was later on breached southwards on November 14, as its price approached the $10 mark, a low it hadn’t seen since September 12.

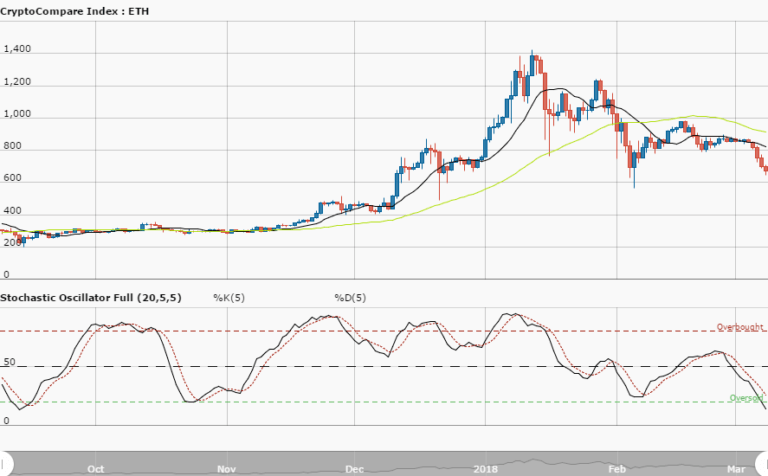
The market appears to now be starting new ranging movements, that have been going on for three days. Ethereum’s two SMAs have their trend lines located within the aforementioned range, with a short space separating them. The 50-day SMA is above the 14-day SMA. The Stochastic Oscillators have moved south past range 20 into the oversold zone.
They appear to be trying to dip even further. Such price movements could indicate the cryptocurrency may enter a consolidation, that will merely represent the bears’ presence. In the next few trading sessions ETH is set to dip a bit further. Two key price territories have been observed and soon a reversal is expected.
The views and opinions expressed here do not reflect that of CryptoGlobe.com and do not constitute financial advice. Always do your own research.