

BTCUSD Medium-term Trend: Bullish
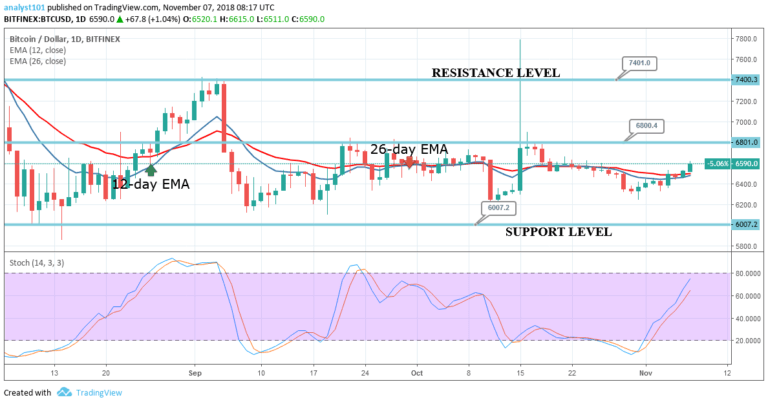
Resistance levels: $7,000, $7,200, $7,400
Support levels: $6,400, $6,200, $6,000
The price of Bitcoin was in a bullish trend yesterday. The digital currency has moved upward and it is likely to face resistance at the $6,600 price level. This was the level the cryptocurrency was range bound since October 15. If the bulls break the $6,600 price level, theprice will rally at the $6,800 price level. The digital currency will resume its uptrend at the $6,800 price level.
It is assumed that the price of Bitcoin will probably reach the highs of $7,400 and $8,000. However, a trend line is drawn to determine the continuity of the bullish trend at the lower time frame. Meanwhile, the BTC price is above the 12-day EMA and the 26-day EMA which indicates that the price is in the bullish trend zone.
The Stochastic indicator is approaching the range of 60 which indicates a buy signal and that the momentum of price is increasing on the upside.
.BTCUSD Short-term Trend: Bullish

On the 4-hour chart, the BTC price is in a bullish trend. On November 6, the price was making a series of higher highs and higher lows. A bullish trend is said to be ongoing if this movement is not disrupted. Meanwhile, the bullish trend is said to be terminated if the price breaks the trend line and the following candlestick closed on the opposite of it. The bullish trend is on course.
The views and opinions expressed here do not reflect that of CryptoGlobe.com and do not constitute financial advice. Always do your own research.


