

BTCUSD Medium-term Trend: Bearish
Resistance levels: $7,000, $7,200, $7,400
Support levels: $4,000, $3,800, $3,600
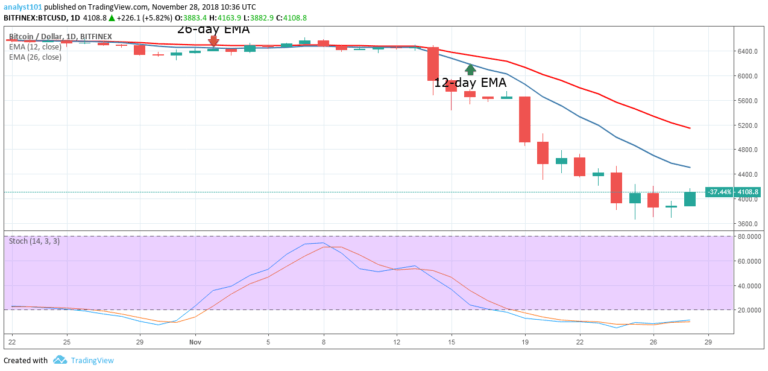
Yesterday, the price of Bitcoin was in a bullish trend. On November 26, the digital currency fell to its low at $3,864.10 and commenced a bullish movement. Today, the price of Bitcoin is making a bullish movement to the 12-day EMA and the 26-day EMA. The price of the crypto is still below the EMAs which indicates that price is in the bearish trend zone.
The EMAs can act as resistance to the crypto’s price. From the daily chart, the Stochastic is in the range below 20. That is the price is in the oversold region, meaning that the bearish trend is strong. The crypto will remain bearish as long as the Stochastic is below 20.
BTCUSD Short-term Trend: Bullish

On the 4-hour chart, the crypto’s price is in a bullish trend. The price of Bitcoin has fallen to the low of $3,757.10 and it commenced a bullish movement to the 12-day EMA and the 26-day EMA. The crypto’s price has broken the 12-day EMA, the 26-day EMA and remains above it. If the bulls sustained their hold above the $4,000 price level, the crypto will resume its uptrend to the high of $4,500 and the $5,000 level.
On the downside, if the bulls fail to hold the price above the $4,000 price level; the digital currency will fall to the $3,500 price level. Meanwhile, the Stochastic is in the range above 40 which indicates that bullish momentum is increasing on the upside.
The views and opinions expressed here do not reflect that of CryptoGlobe.com and do not constitute financial advice. Always do your own research.


