

BTCUSD Medium-term Trend: Bearish
Resistance levels: $7,000, $7,200, $7,400
Support levels: $4,400, $4,200, $4,000
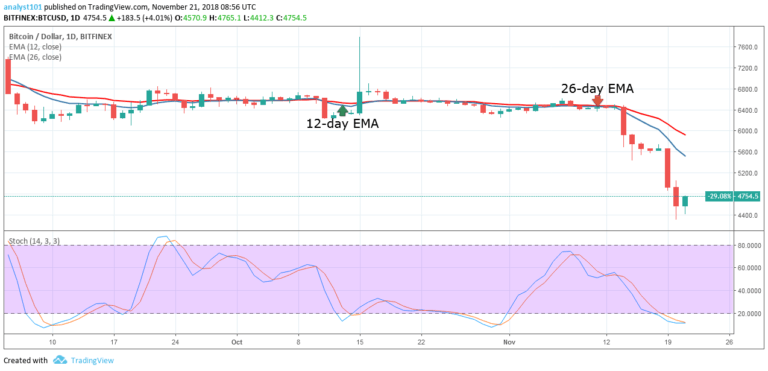
On November 20, the price of Bitcoin was in a bearish trend as the price fell to the low of $4,571. On the lower time frame, the price fell to the low of $4,510.20 and commenced a range bound movement. From the daily chart, the Stochastic is in the range below 20 showing a strong bearish trend. The price is still below the 12-day EMA and the 26-day EMA indicating that it is in the bearish trend zone.
However, a bearish trend line is drawn to determine the continuity of the bearish trend.
BTCUSD Short-term Trend: Ranging

On the 4-hour chart, the crypto’s price is in a sideways trend. A bearish trend line is drawn showing the resistance levels of the price. A bearish trend is said to be terminated if the price breaks the trend line and the following candlestick closes on the opposite of it. From the chart, a bullish candlestick broke the trend line and was closed opposite.
Technically, the bearish trend is said to over. In addition, the red and blue bands of the stochastic are above the range of 20. This indicates a buy signal and shows that the current trend has been reversed.
The views and opinions expressed here do not reflect that of CryptoGlobe.com and do not constitute financial advice. Always do your own research.


