

BTCUSD Medium-term Trend: Bullish
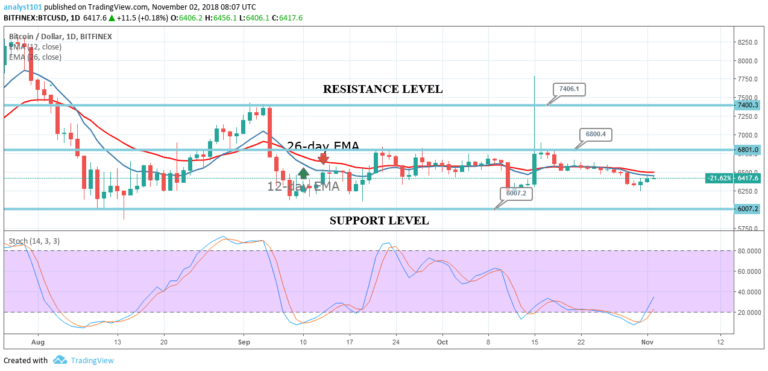
Resistance levels: $7,000, $7,200, $7,400
Support levels: $6,300, $6,100, $5,900
The price of Bitcoin is in a bullish trend. Since on October 15, the crypto’s price was range bound above the $6,500 price level. On October 29, it broke out from the range bound movement and fell to the low of $ 6,300 to commence another range bound movement. Today, from the price action, Bitcoin is in a bullish trend but price is within the bearish trend zone.
The price of Bitcoin is below the 12-day EMA and 26-day EMA which makes it look bearish. But if the bullish trend continues, the price will fall within the bullish trend zone. However, the stochastic indicator confirms a bullish trend. The Stochastic indicator had previously shown that Bitcoin as being oversold. That is, the momentum was strong on the downward trend.
Today, it shows that Stochastic is above 20. That is the bearish trend is reversing as the blue band of the indicator is above the red band. Secondly, the bands are out of the oversold region of the chart. Nevertheless, if the BTC price breaks the resistance levels of $6,600 and $6,800, the price will rally at $7,400.
BTCUSD Short-term Trend: Bullish

On the short term trend, Bitcoin is in a bullish trend. The Stochastic indicator is above 80. This explains that the bullish trend is strong. There is the tendency that price is likely to close near the top and continue its bullish movement. The crypto’s price can probably reach the highs of $6,800 and $7,400 price levels
The views and opinions expressed here do not reflect that of CryptoGlobe.com and do not constitute financial advice. Always do your own research.


