

Bitcoin Price Medium-term Trend: Bearish
Resistance levels: $7,000, $7,200, $7,400
Support levels: $5,200, $5,000, $4,800
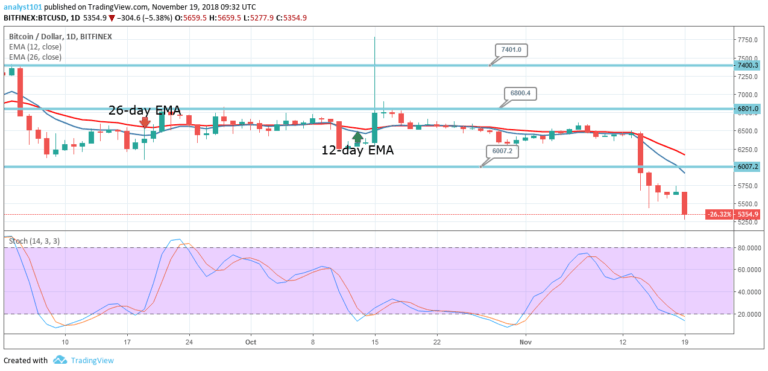
Last week the price of Bitcoin was in a bearish trend after the critical support level was broken. The crypto’s price broke the 12-day EMA, 26-day EMA and the support level of $6,000. It is trading close to the $5,200 price level as at the time of writing. The price of Bitcoin is below the 12-day EMA and the 26-day EMA indicating that price is likely to continue falling.
Meanwhile, the stochastic oscillator is in the range below 20 which indicates that the bearish momentum is strong. In addition, as long as the blue and red bands remain below the range of 20, the bearish pressure will continue. The crypto’s price has reached the oversold region of the market. The levels of $5,200 and $5,000 are likely to be tested or broken.
BTCUSD Short-term Trend: Bearish

On the 4-hour chart, the crypto’s price is in a bearish trend. On November 19, the range bound movement of the digital currency was resisted by the 12-day EMA and price continued its downward fall. If the bearish trend continued the support levels would be breached. Meanwhile, the Relative Strength Index period 14 is level 22 which indicates that the market oversold suggesting bulls to take control of the market, albeit briefly.
The views and opinions expressed here do not reflect that of CryptoGlobe.com and do not constitute financial advice. Always do your own research.


