
 Litecoin Chart by Trading View
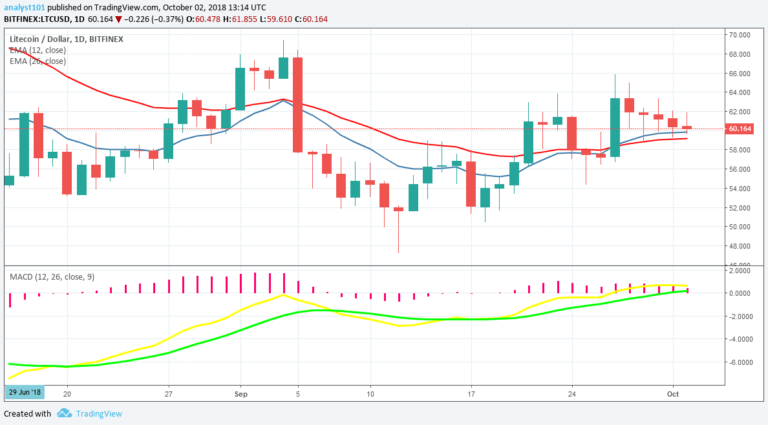
Litecoin Price Medium-term Trend: Ranging
Resistance Levels: $63, $65, $67
Support Levels: $58, $56, $54
In the last four days, the LTC price had been in a range bound movement. On September 29, the cryptocurrency had been fluctuating above the $60 price level. One reason is that the LTC price is consolidating for a possible breakout.
The LTC price is still above the 12-day EMA and the 26-day EMA which indicates that a bullish trend is continuing. The MACD line and Signal line are at par with the zero line which indicates a neutral signal.
LTCUSD Short-term Trend: Ranging
 Litecoin Chart by Trading View
On the 4-hour chart, the LTC price is ranging above the $60 price level. The price of Litecoin is neither above nor below the 12-day EMA and the 26-day EMA which indicates that price is in the sideways trend zone. The Relative Strength Index period 14 is level 47 indicates that price is in a sideways trend zone.
The views and opinions expressed here do not reflect that of CryptoGlobe.com and do not constitute financial advice. Always do your own research.


