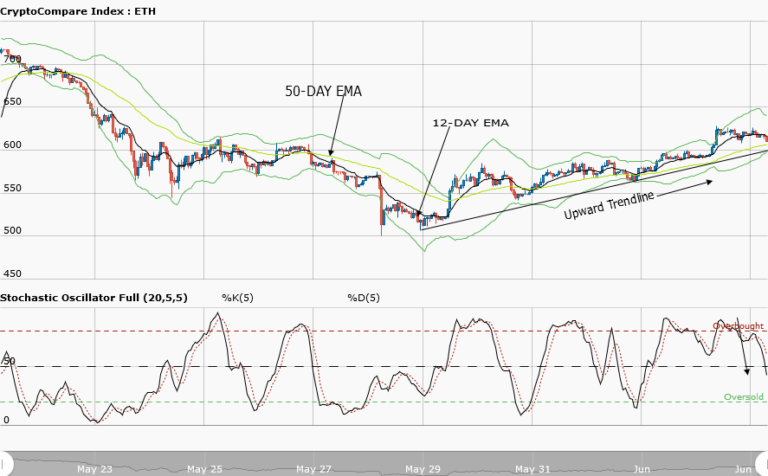
Ethereum Price Medium-term Trend: Ranging
Supply zones: $400, $450, $500
Demand zones: $150, $100, $50
ETH is in a range in its medium-term outlook. $203.70 in the supply area was the high the bulls could push ETHUSD over the weekend before the bears’ sets in. This was signalled by the bearish railroad at $202.66 on 14th October. $194.04 in the demand area was the low yesterdat.
The 4-hour opening candle at $195.67 was a bullish pinbar that showed the bulls may have returned. $242.62 in the supply area was retested earlier today but the stochastic oscillator is at 38% and its signal points down. The move may therefore be a fakeout, traders should be patient.
ETH is in consolidation and trading between $240.00 in the upper supply area and at $189.45 in the lower demand area of the range. A breakout at the upper supply area or breakdown at the lower area may occur hence patience is required to allow this to happen before a position is taken.
Ethereum Price Short-term Trend: Bearish
ETH is in a bearish trend in its short-term outlook. The bears’ pressure that pushed ETHUSD to $194.49 in the demand area was short-lived. The 1-hour opening candle at $199.07 was bearish and the price was further down to $194.04 in the demand area. The bulls return was gradual and signalled by the pinbar formation at $196.75.
Increased bullish momentum saw ETHUSD at $242.62 in the supply area. This created the double top and that brought the bears back to the market.
The price was down to $206.00 in the demand area. The stochastic oscillator is at 67% and its signals point down which implies downward price movement in the short-term.
The views and opinions expressed here do not reflect that of CryptoGlobe.com and do not constitute financial advice. Always do your own research


