
ETHUSD Long-term Trend – Ranging
Distribution territories: $350, $450, $550.
Accumulation territories: $150, $100, $50.
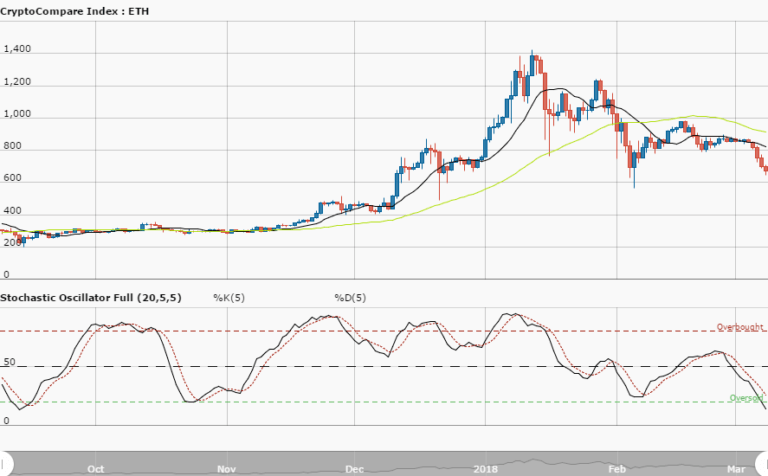
Ethereum has been under its 50-day SMAs trend line for the past few months. The 14-day SMAs trend line has been briefly breached northwards, but the cryptocurrency eventually succumbed to the US dollar.

The cryptocurrency hasn’t been able to make a significant bullish move upwards as it has been raging along its 14-day SMA, at around the $200 price territory. The 50-day SMA is far from the 14-day SMA as the former is over the latter.
The Stochastic Oscillators have moved past range 40 and now faintly point north. This means the bulls are likely getting ready to make a move on the market. The current lack of wild swings, however, can keep on lasting throughout the next few trading sessions.
A breakout above the range’s upper levels could mean the cryptocurrency reaches other distribution territories. Meanwhile, traders are advised to watch out for a strong reversal.
The views and opinions expressed here do not reflect that of CryptoGlobe.com and do not constitute financial advice. Always do your own research.


