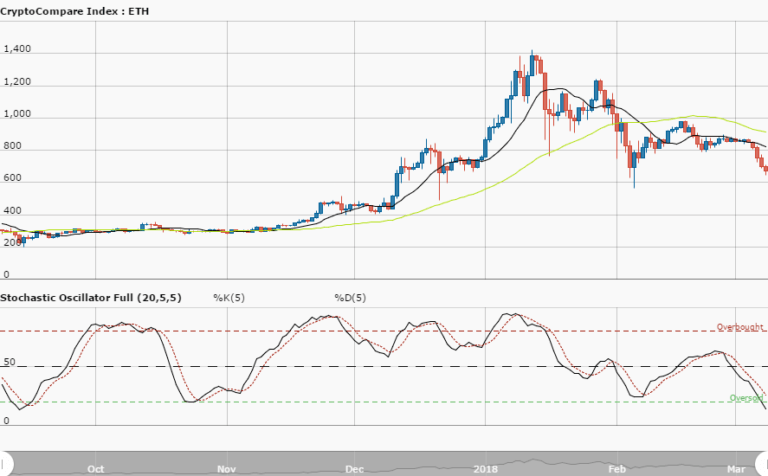
ETHUSD Long-term Trend – Ranging
Distribution territories: $350, $450, $550.
Accumulation territories: $150, $100, $50.
On October 11 the cryptocurrency market endured a significant fall that had its effects on most top cryptocurrencies, including Ethereum. The cryptocurrency has been losing value against the US dollar for the past few months, accompanied by both SMAs.
The $300 and $200 price territories are still the top and bottom of Ethereum’s current range. The 14-day SMAs trend line has been an indicator that clarifies the direction the cryptocurrency has been following. Within the range, the 50-day SMA is above the 14-day SMA.
The Stochastic Oscillators have moved down to briefly touch range 20. This means the market may keep on dipping. It’s currently uneconomically healthy to think about ETH dipping to the $150 accumulation territory.
A reversal against said territory or a breakout above the upper level of its range could build formidable foundations for a bullish trend.
The views and opinions expressed here do not reflect that of CryptoGlobe.com and do not constitute financial advice. Always do your own research.


