

BTCUSD Medium-term Trend: Ranging
Resistance levels: $7,000, $7,200, $7,400
Support levels: $6,500, $6,300, $6,100
The BTCUSD pair had been range-bound in the last five days with the appearance of indecisive candlesticks pattern. Doji and spinning tops candlesticks appeared at the $6,500 price level indicating that the supply and demand are in equilibrium. The price of Bitcoin will remain the same as long as these small body candlesticks appear. Meanwhile, the bulls and bears are undecided where the price will go.
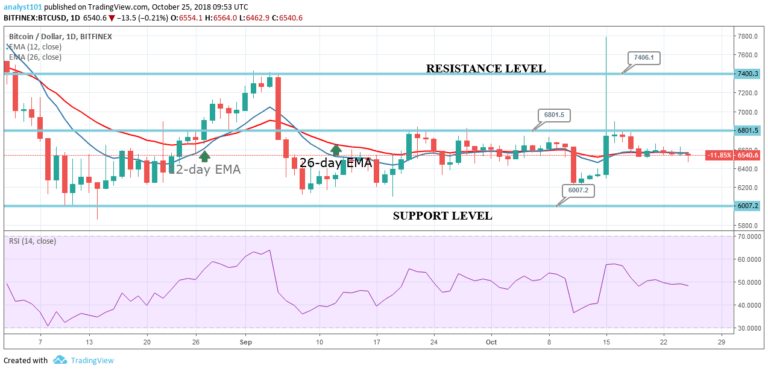
From the daily chart, If the price eventually breaks upward, it will break up the $6,800 price level. This will see price rise to the $7,400 price level. If the bulls sustain the price at that level; the price of Bitcoin will resume its uptrend to the highs of $8,000 and $8,500.On the downside, if the price breaks the $6,500 price level, the crypto’s price will revisit the $6,000 price level.
Nevertheless, the Relative Strength index period 14 is level 48 which indicates that the price is in a sideways trend zone.
BTCUSD Short-term Trend: Ranging

On the short term trend, Bitcoin is in a sideways trend. The 12-day EMA, 26-day EMA and the price bars (indecisive candlesticks) are horizontally flat indicating a sideways trend. The price of Bitcoin is below the 12-day EMA and 26-day EMA which indicates that the price is falling.
The views and opinions expressed here do not reflect that of CryptoGlobe.com and do not constitute financial advice. Always do your own research.


