

BTCUSD Medium-term Trend: Bearish
Resistance levels: $6,600, $6,800, $7,000
Support levels: $6,300, $6,100, $5,900
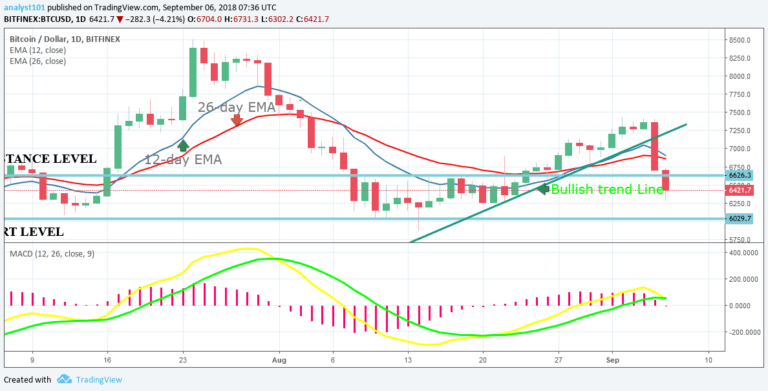
Yesterday, the BTCUSD pair was in a serious bearish trend. While it was ranging at the $7,300 price level, the bears resisted price at $7,402.14 and $7,381.17. It was at the high of $7,377.67 price level, before falliong down to the low of $6,418.43. Traders who had not taken their stop losses to breakeven point would have suffered losses.
There are indications that price of Bitcoin might likely revisit the previous low of $6,000 if the bearish pressure continued. Also, the MACD line and the signal line are above the zero line which indicates a buy signal.
In addition, the price of Bitcoin is below the 12-day EMA and the 26-day EMA which indicates that the BTC price is falling.
BTCUSD Short-term Trend: Bearish

From the 4-hour chart, the BTC price is in a bearish trend. The price of the cryptocurrency broke the bullish trend line in a price spike. The cryptocurrency is likely to fall because the price is below the 12-day EMA and 26-day EMA . Meanwhile, the Relative Strength Index period 14 is level 17 which indicates that the market is oversold suggesting bulls might take control of market.
The views and opinions expressed here do not reflect that of CryptoGlobe.com and do not constitute financial advice. Always do your own research.


