
BTCUSD Long-term Trend – Bearish
Distribution territories: $8,000, $9,000, $10,000.
Accumulation territories: $5,500, $4,500, $3,500.
Bitcoin’s price movements on September 2 and 4 showed the cryptocurrency was struggling to maintain an upward movement against the US dollar. On September 5, the cryptocurrency saw its price plunge from $7,400 to around $6,685. This saw the crypto be further pushed south on September 6 and 7.

It has been noted the decline was caused on September 5 by a strong Japanese bearish engulfing candlestick, which enclosed all the bullish gains the cryptocurrency made between august 27 and September 4.
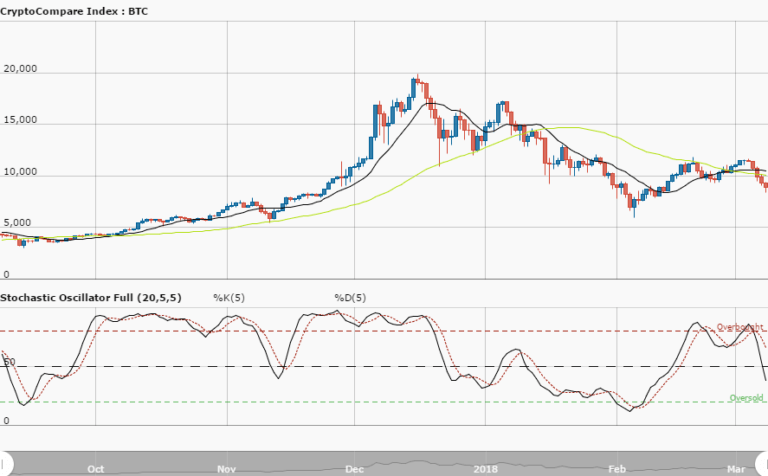
Currently, BTC is trading between the territories of $6,600 and $6,200. The two SMAs are bent southwards between the distribution and accumulation territories of $7,200 and $6,800. The 50-day SMA is over the 14-day SMA.
The Stochastic Oscillators have crossed the overbought region, and now point south within the ranges of 80 and 60. This indicates the bearish market is still going. The cryptocurrency’s price, by every indication, will keep falling to the accumulation territories of $6,000, $5,500 and $5,000 in the next few days or weeks.
Taking that into account a bullish trend may then use said territories to gather momentum in a comeback. Investors should wait for the correction to occur before entering the market.
The views and opinions expressed here do not reflect that of CryptoGlobe.com and do not constitute financial advice. Always do your own research.


