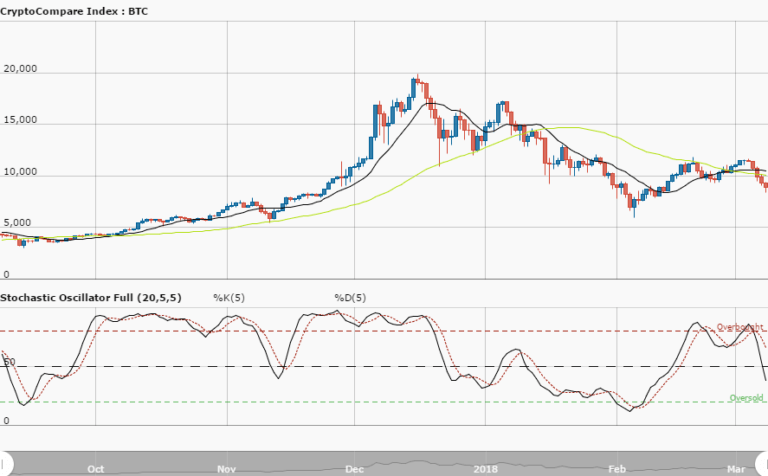
BTCUSD Long-term Trend – Bullish
Distribution territories: $8,000, $9,000, $10,000.
Accumulation territories: $6,000, $5,000, $4,000.
Bitcoin’s price has considerably increased against the US dollar this week. A few weeks ago, the cryptocurrency was moving in range-bound territories market by the distribution and accumulation territories of $7,000 and $6,000.
On Aug. 26, the cryptocurrency saw its price briefly drop towards $6,565, and on the following day, Aug. 27, rise to touch the 50-day SMA from below at around $6,950. BTC was able to break the 50-day SMA’s trendline towards the $7,200 mark on Aug. 28.
Its price is currently hovering between the territories of $7,200 and $6,800, with the 50-day SMA standing between them. The 50-day SMA is above the 14-day SMA. The Stochastic Oscillators have moved past range 80 and seem to be consolidating above it. This shows the market’s bullish move is still ongoing.
The current accumulation territory is now located at $6,500 as the bears may not be able to breach easily breach it. In the aftermath of the intersection of the 50-day SMA by the 14-day SMA from below, a bullish trend could be said to be confirmed. Traders should now watch for a strong reversal of potential bearish movements to enter a long position.
The views and opinions expressed here do not reflect that of CryptoGlobe.com and do not constitute financial advice. Always do your own research.


