
 Litecoin Chart by Trading View
Litecoin (LTC) Price Analysis – August 31
LTCUSD Medium-term Trend: Ranging
Resistance Levels: $60, $65, $70
Support Levels: $50, $45, $40
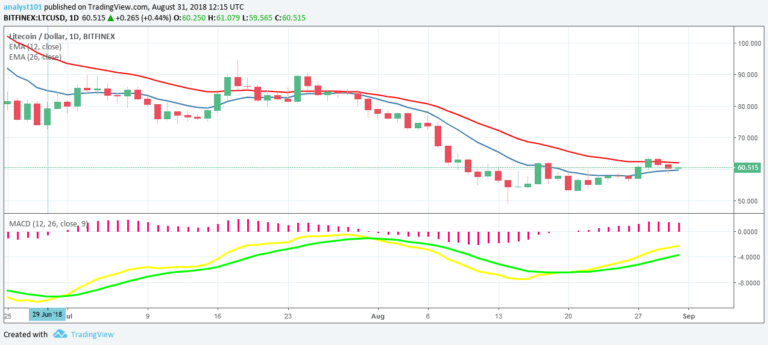
Yesterday, the LTCUSD pair was in a downward trend and the price of Litecoin fell to the low of $58.65. Today, the price of Litecoin had a bullish movement to the high of $60 price level. In a ranging market, traders should always initiate a long trade after price tests the lower level of a price range.
Also, to initiate a short trade after price tests the upper level of the price range. Litecoin price is expected to retest the upper level of the price range. Nevertheless, the MACD line and the signal line are below the zero line which indicates a sell signal. Also, the price of Litecoin is below the 12-day EMA and the 26-day EMA which indicates that price is falling
LTCUSD Short-term Trend: Ranging
 Litecoin Chart by Trading View
On the 4-hour chart, the LTC price is in a sideways trend. In the sideways trend, the price is approaching the $60 price level. Meanwhile, the Relative Strength Index period 14 is level 53 which indicates that price is in the sideways trend zone.
The views and opinions expressed here do not reflect that of CryptoGlobe.com and do not constitute financial advice. Always do your own research.


