
 Litecoin Chart by Trading View
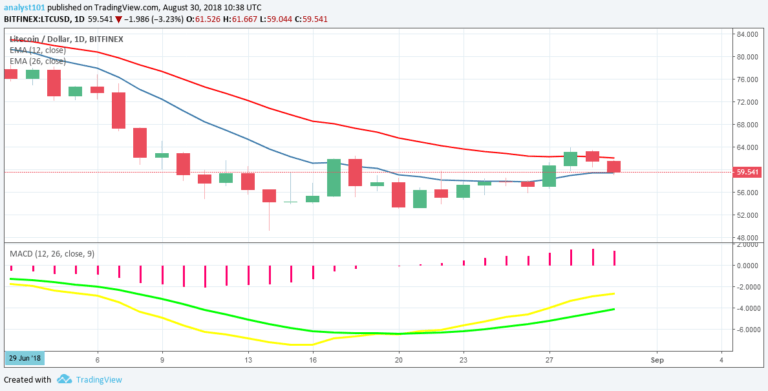
LTCUSD Medium-term Trend: Ranging
Resistance Levels: $60, $70, $80
Support Levels: $50, $40, $30
Yesterday, the price of Litecoin was in a downward trend. The bearish trend was a result of the bull’s failure to sustain their hold on the price above the $62 price level. The LTC price is now falling and approaching the lower level of a price range. The cryptocurrency is expected now to fluctuate between the levels of $62 and $50.
If the price gets to the lower level of a price range and holds, traders should initiate long trades. However, the MACD line and the signal line are below the zero line which indicates a sell signal. Also, the price of Litecoin is below the 12-day EMA and the 26-day EMA which indicates that the bearish trend is ongoing.
LTCUSD Short-term Trend: Bearish
 Litecoin Chart by Trading View
On the 4-hour chart, the LTC price is in a downward trend. The price is below the 12-day EMA and the 26-day EMA which indicates that the price of Litecoin is falling. Meanwhile, the Relative Strength Index period 14 is level 47 which indicates that price is in the range-bound zone.
The views and opinions expressed here do not reflect that of CryptoGlobe.com and do not constitute financial advice. Always do your own research.


