
 Litecoin Chart by Trading View
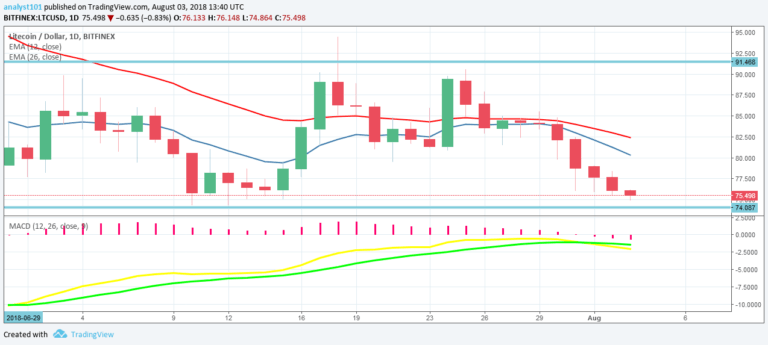
Litecoin Price Medium-term Trend: Bearish
Resistance Levels: $78, $80, $82
Support Levels: $74, $72, $70
Yesterday, August 2, Litecoin’s price was in a downward trend. The cryptocurrency’s price hasn’t been able to break the support level at $74. This because the support level was a critical one that hasn’t ben broken since the beginning of the year. If LTC breaks said level, its price will find support at $57.
If the support isn’t broken, LTC will move in a range bound movement. Meanwhile, the MACD and signal lines are below the zero line which indicates a sell signal. Moreover, Litecoin’s price is below the 12-day EMA and the 26-day EMA which indicates a bearish trend is ongoing
Litecoin Price Short-term Trend: Bearish
 Litecoin Chart by Trading View
On the 4-hour chart, LTC is on a downward trend. Its price shows a bearish candlestick approaching to break the support level at $74. Meanwhile, the Relative Strength Index period 14 is level 37 which indicates the market is oversold, suggesting bulls may take over.
The views and opinions expressed here do not reflect that of CryptoGlobe.com and do not constitute financial advice. Always do your own research.


