
 Litecoin Chart by Trading View
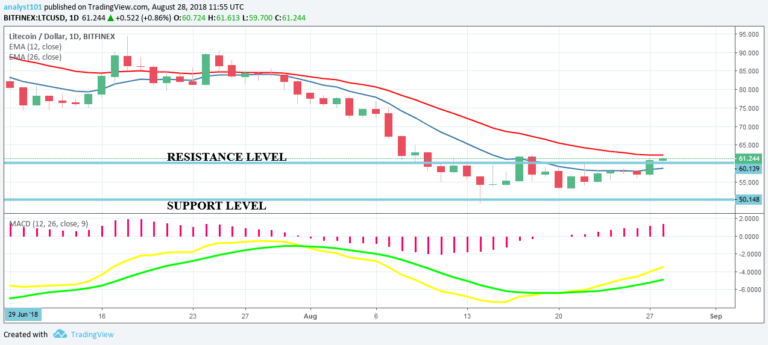
LTCUSD Medium-term Trend: Ranging
Resistance Levels: $70, $80, $90
Support Levels: $50, $40, $30
Yesterday, the LTCUSD pair was in a sideways trend. In the sideways trend, the price of Litecoin was approaching the upper level of the range bound zone. Today, the price has broken the upper level of the range bound zone which is the $60 price. Nevertheless, as THE price progresses the cryptocurrency may face resistance at the price of $62.
This is because the price of Litecoin has been resisted in previous attempts. If the price is resisted again it may be compelled to a range bound movement above the $60 price level or pullback into the range bound zone. Nevertheless, the MACD line and the signal line are below the zero line which indicates a sell signal.
The price of Litecoin is below the 12-day EMA and the 26-day EMA which indicates that the price is falling.
LTCUSD Short-term Trend: Bullish
 Litecoin Chart by Trading View
On the 4-hour chart, the LTC price is in a bullish trend. A large bullish candlestick broke the upper level of the range bound zone. The price at $60 is the broken level and our new support level to initiate long trades if the level holds. Meanwhile, the Relative Strength Index period 14 is level 69 which indicates that the price is in the bullish trend zone.
The views and opinions expressed here do not reflect that of CryptoGlobe.com and do not constitute financial advice. Always do your own research.


