
 Litecoin Chart by Trading View
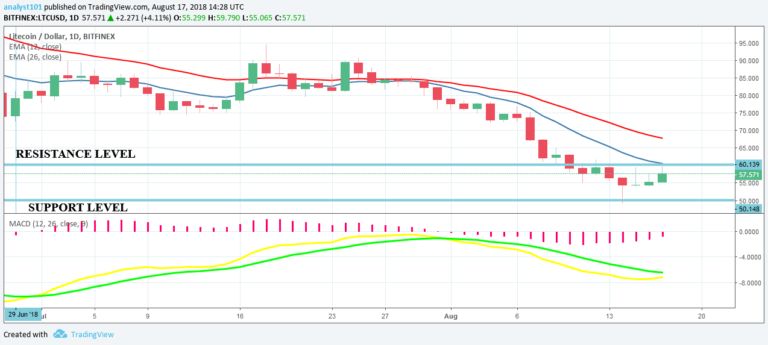
LTCUSD Medium-term Trend: Bullish
Resistance Levels: $58, $59, $60
Support Levels: $55, $54, $53
Yesterday, Litecoin was in a range bound movement. Its price was essentially horizontal, as it had been range bound between the levels of $60 and $50 after the market went oversold. LTC is now approaching the resistance level at $60. If the level is broken, LTC will soar higher and will be out of the range-bound zone.
If it faces resistance at said level it will continue with its fluctuations. From the chart, the MACD and signal lines are below the zero line which indicates a sell signal. Litecoin is below the 12-day EMA and the 26-day EMA which indicates the price was falling
LTCUSD Short-term Trend: Ranging
 Litecoin Chart by Trading View
On the 4-hour chart, LTC is range bound. The cryptocurrency is approaching a resistance level at $60. If it fails to break it, a short trade should be initiated with a stop loss above the resistance level.
Traders can exit this position when the price falls near the support zone. Meanwhile, the Relative Strength Index period 14 is level 56 which indicates that price is in the range bound trend zone.
The views and opinions expressed here do not reflect that of CryptoGlobe.com and do not constitute financial advice. Always do your own research.


