LTCUSD Long-term Trend – Bearish
Distribution territories: $100, $120, $140.
Accumulation territories: $70, $50, $30.
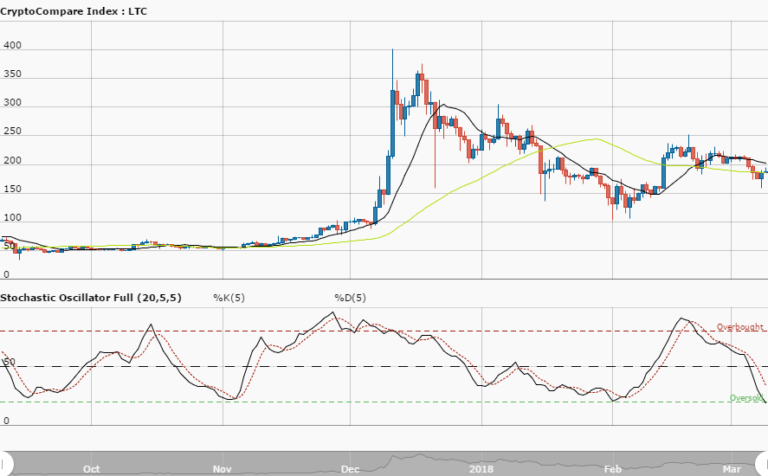
The bears have been significantly influencing the price of Litecoin this week. Since July 24, while the crypto’s price was above the 14-day SMA and was pushed further northbound to touch the 50-day SMA, it kept on been experiencing a series of declines. The cryptocurrency has been continually falling, and now seems to be being driven towards a low once experienced on June 28 and July 10.
The two SMAs are closely moving a bit above the accumulation territory of $80. The price has been trading below the two SMAs in the last couple of days. The Stochastic Oscillators have crossed and moved to touch range 20, but still point south.
This suggests the bearish trend is still in play. The crypto may need to briefly push further southwards to start recovering. However, the bulls will have to build upon any correction that can possibly occur. Investors may have to wait for an upward breakout to engage in good long entries. Traders may wait for the price to push southward a bit to initiate a buy order
The views and opinions expressed here do not reflect that of CryptoGlobe.com and do not constitute financial advice. Always do your own research.


