

BTCUSD Medium-term Trend: Bearish
Resistance levels: $7,100, $7,200, $7,300
Support levels: $6,900, $6,800, $6,700
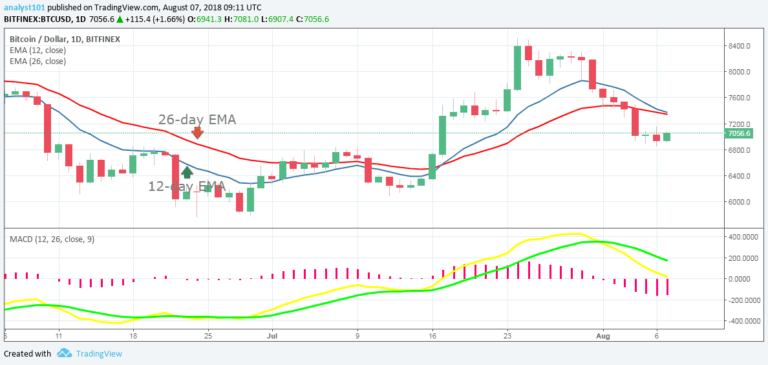
Yesterday, August 6th, the BTC price was in a downward trend. It was assumed that if price were to break the $7,048 price level, the Bit would fall to the lows of either $6,500 or $6,000. However, the price fell to the low of $6,941.85 and pulled back to the price above $7,000. Yesterday, at the lower time frame, the BTC price had been range-bound at the $6,941.85 price level.
Later the BTC price had a bullish breakout above the $7,000 price level. Today, the price of Bitcoin is likely to rise and might eventually retest the $8,400 price level. Meanwhile, the MACD line and the signal line are above the zero line which indicates a buy signal. In addition, the price of Bitcoin is below the 12-day EMA and the 26-day EMA which indicates that the price was previously falling.
BTCUSD Short-term Trend: Bullish.

From the 4-hour chart, a bearish trend line is attached to determine the continuity of the bearish pressure. On the chart, a bullish candlestick has broken the bearish trend line thus ending the downward trend. The assumption is that if the price breaks a trend line and the candlestick closes opposite it, the previous trend can be said to be over. In the other words, we may see a bullish trend return.
The views and opinions expressed here do not reflect that of CryptoGlobe.com and do not constitute financial advice. Always do your own research.


