

BTCUSD Medium-term Trend: Bullish
Resistance levels: $7,200, $7,400, $7,600
Support levels: $6,900, $6,800, $6,700
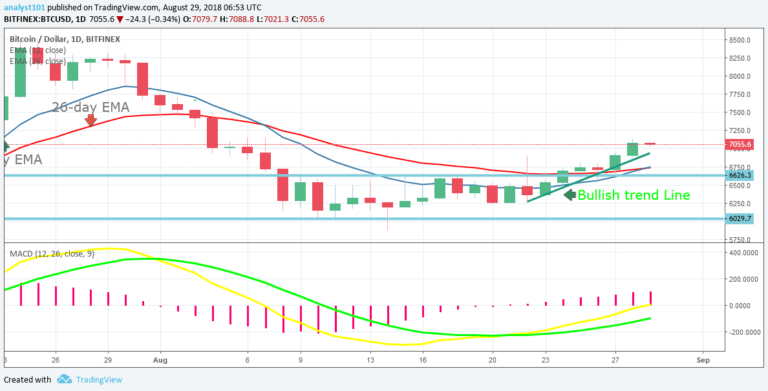
Yesterday, the BTCUSD pair was in a bullish trend and while in the trend the $7,000 price level was broken. As earlier suggested the cryptocurrency will likely pick up momentum to reach the high of $8,500. Today, the BTC price is still in a bullish trend. In the lower time frame, the cryptocurrency is retracing and a bullish trend line is drawn showing the support levels of price.
If the bitcoin price retraces and tests the trend line it is a signal to initiate a long trade. If the BTC price breaks the trend line and the candlestick closes on the opposite of the trend line; it is a signal that the trend is likely to change.
Meanwhile, the MACD line and the signal line are above the zero line which indicates a buy signal. In addition, the price of Bitcoin is above the 12-day EMA and the 26-day EMA which indicates that the BTC price is rising.
BTCUSD Short-term Trend: Bullish

From the 4-hour chart, the bitcoin price is in a bullish trend. On the chart, the BTC price is making a series of higher highs and higher lows. Meanwhile, the Relative Strength Index period 14 is level 73 which indicates that price is in the bullish trend zone.
The views and opinions expressed here do not reflect that of CryptoGlobe.com and do not constitute financial advice. Always do your own research.


