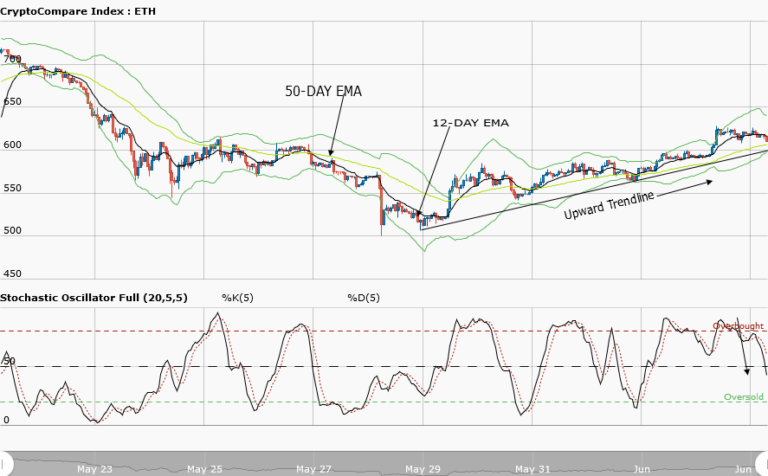
Ethereum Price Medium-term Trend: Ranging
Supply zones: $600, $650, $700
Demand zones: $300, $250, $200
ETH continues ranging in the medium-term outlook. The bearish momentum was sustained as price was pushed down to $449.20 in the demand area with a large bearish engulfing candle. The bears’ momentum saw price further down to $446.00 in the demand area.
However, formation of a bearish spinning top and a doji that are reversal candlestick patterns serves as double confirmation for the bulls return. Price was pushed up to $480.42 in the supply area with a large bullish engulfing candle that closed above the two EMAs.
ETH is still in consolidation and is trading between $481.55 in the supply area of the upper price range and at $444.45 in the demand area of the lower price range. Traders should patiently wait for a breakout from the upper price range or a breakdown at the lower price range before entering the market.
Ethereum Price Short-term Trend: Bullish
Ethereum price is in a bullish trend in the short-term outlook. The bearish pressure led to the break of $451.52 the lower range of yesterday analysis and went further down to $446.00.
The bulls returned as we have the formation of doji at the demand area. The bullish pressure was strong as price returned back to the range and went up to $468.55 in the upper supply area for the fourth touch. The touch led to a breakout and retest before a further move up to $480.42 in the supply area.
Price is above the EMAs crossover with the Stochastic oscillator at the overbought which is a reflection of upward momentum in price due to the bullish pressure.
The views and opinions expressed here do not reflect that of CryptoGlobe.com and do not constitute financial advice. Always do your own research.


