ETHUSD Long-term Trend – Bearish
Distribution territories: $600, $650, $700.
Accumulation territories: $350, $300, $250.
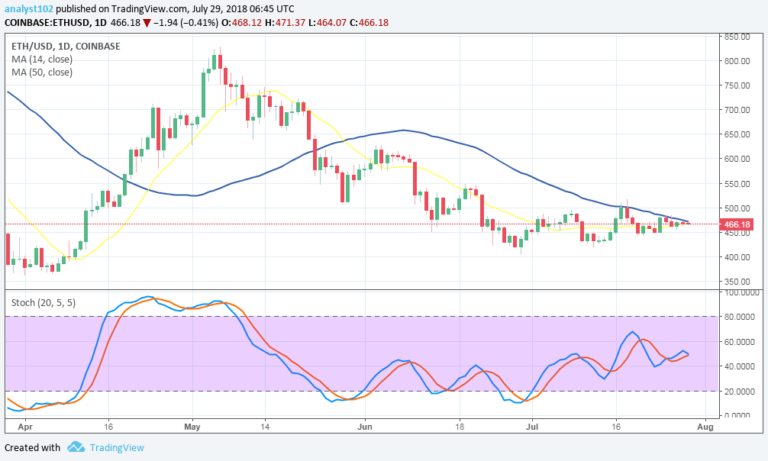
Ethereum is currently undervalued by the market, because of the weight of the US dollar that’s still in play. Over the past few weeks, the cryptocurrency has neither ben traded along the trend-line of the 14-day SMA or the 50-day SMA. The bulls managed to push its value upwards to touch the trend-line of the 50-day SMA on July 24.

The last time Ethereum struggled to get past the 50-day SMA was on April 19. Currently, the bulls have been feebly staging a comeback as the bears are still being able to shut down their efforts to bring ETH up.
The 14-day SMA is getting close to the 50-day SMA. The Stochastic Oscillators initially moved south to touch range 40, and are now a bit above it pointing south. This means traders should be careful entering positions, at least foe a while.
A bullish Japanese candlestick can suddenly emerge to give ETH a boost and help it push past the distribution territory of $500. A break below the territory of $420 can see its price go south to test the accumulation territory of $400. It is now better to await for the price to define a direction.
The views and opinions expressed here do not reflect that of CryptoGlobe.com and do not constitute financial advice. Always do your own research.