

BTCUSD Medium-term Trend: Bearish
Resistance Levels: $6,500, $6,550, $6,600
Support Levels: $6,400, $6,350, $6,300
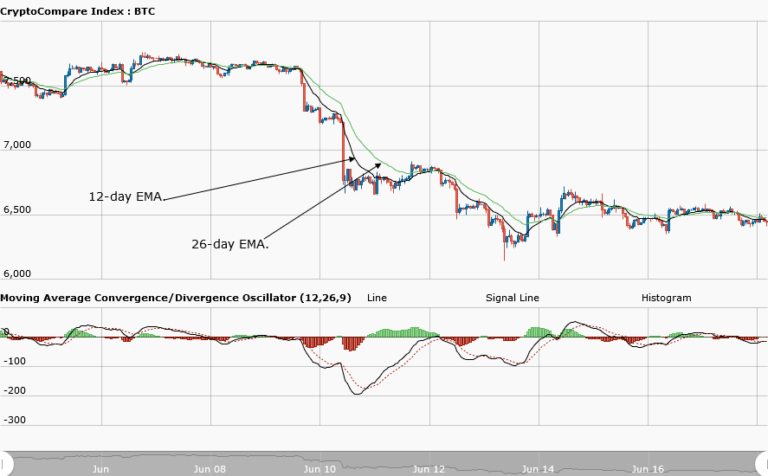
Last week, price of Bitcoin was in a downward trend. The asset traded at the beginning of last week from the high of $7,625.70 to the low of $6,487.35. From the price action, the overall trend is bearish, but the asset is ranging from the resistance level at $6,550 to the support level at $6,400. Meanwhile, the MACD line and the signal line are below the zero line indicating a sell signal.
In addition, the 12-day EMA and 26-day EMA is neither above nor below the price of the asset. This is a neutral signal as the exponential moving averages failed to determine the continuity of the trend
BTCUSD Short-term Trend: Bearish

On the daily chart, the fallen price is fluctuating below and above the $6,500 price level. If the price of the asset continued its range bound movement; a short trade should be taken, if price gets to the resistance level. Then you exit near the support zone. Similarly, you take a long trade if price gets to the support level and you exit near the resistance zone. Meanwhile, on the daily chart, the MACD line and the signal line are below the zero line indicating a sell signal
The views and opinions expressed here do not reflect that of CryptoGlobe.com and do not constitute financial advice. Always do your own research.


