
NEOUSD Medium-term Trend: Bearish
Supply zones: $80.00, $90.00, $100.00
Demand zones: $50.00, $40.00, $30.00
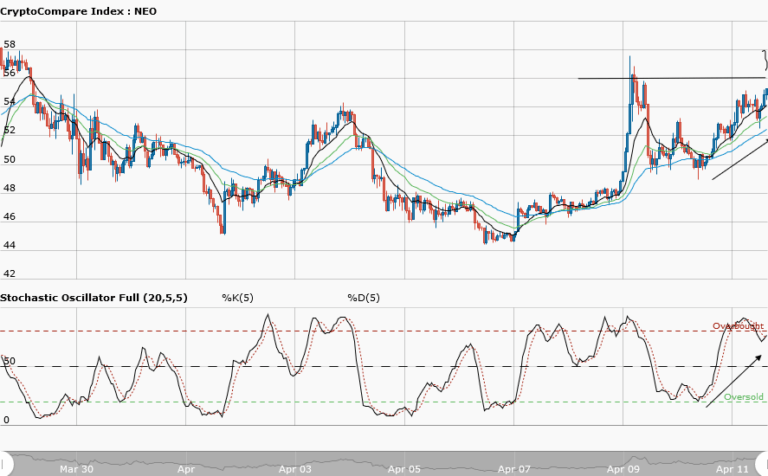
The bears are still in control of Neo in the medium-term. The bears kept the momentum up and pushed the price down into the $59.00 demand area again. This made it the third touch in this area. The triple bottom formation resulted in the bullish move. The price was pushed to the $63.00 supply area. At this area, you can see a bearish railway track formation. This brought the sellers back, pushing the price below the moving averages crossover into the demand area. The stochastic oscillator is in the overbought region with its signals pointing down. This suggests a downward momentum further pushing the price southward. The daily candle opened at $61.33 against yesterday’s opening of $62.35 which represents more sellers’ presence. A pullback to the upside may be seen but this should be seen as a market correction for further downtrend continuation.
NEOUSD Short-term Trend: Ranging

Neo returns to the range in the short-term. The bearish momentum that saw the price pushed to the $59.00 demand area the second time was lost as the bull staged a comeback. This is due to the formation of a double bottom in this area. $63.50 was the new supply area that the bulls were able to push price to, after a repeated attempt for a higher move failed. This brought in the bears that pushed the price down to the $61.00 demand area. Neo is trading within the $63.00 upper supply zone and the $60.00 demand zone. Traders should exercise patience for a breakout and retest from the upper price range, to place a buy or a breakdown and retest at the lower demand zone, before selling to continue the ride to southward
The views and opinions expressed here do not reflect that of CryptoGlobe.com and do not constitute financial advice. Always do your own research.