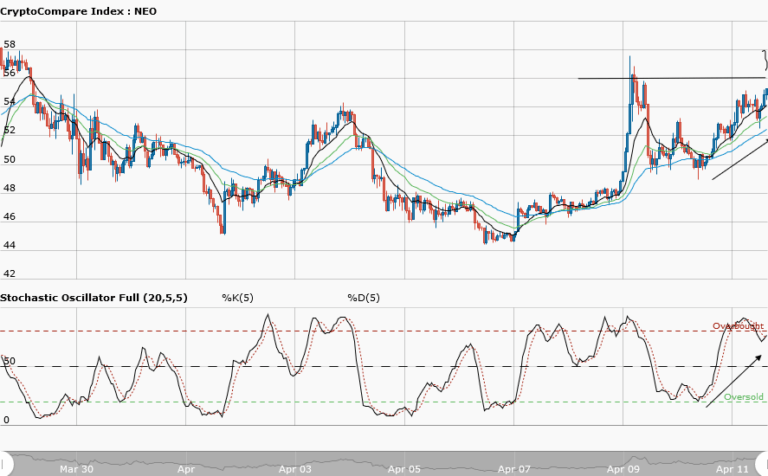
NEOUSD Medium-term Trend: Bearish
Supply zones: $80.00, $90.00, $100.00
Demand zones: $50.00, $40.00, $30.00
The bearish trend continues for Neo in the medium-term. The bears were not letting go of the market as they keep increasing their momentum, pushing the price further down to the $59.00 demand area. The bounce at the trendline was as a result of the bulls’ failure to breakout and subsequent bears pressure. Long bearish engulfing candle broke the $65.00 demand zones and pushed the price below the three exponential moving averages crossover. Likewise, another long bearish engulfing candle broke the $60.00 demand zone. All these are confirmations of the bears’ strong dominance. The three exponential moving averages are fanned apart which connotes strength in the context of the trend, in this case, the downtrend.$60.00 appears to be a strong demand zone as we see the bull’s reaction at this point. It may likely not hold for a long time as the bears gather more momentum. Daily candles opened bearish at $62.35 against yesterday’s open of $65.34, which means more seller presence.
NEOUSD Short-term Trend: Bearish
The bears are in control of Neo in the short-term. Breaking the $63.00 lower demand area of yesterday’s range was a justification of the bears’ overall dominance of the market. The bulls lost momentum as they failed to push the price above the upper supply area of the range. This resulted in the bears’ strong comeback. They pushed the price further down to the $59.00 new demand area. The price is forming lower highs and lower lows as seen from the chart. This is characteristic of a downtrend market scenario. The journey to the south continues as we are likely to see more sellers in the market in the short-term.
The views and opinions expressed here do not reflect that of CryptoGlobe.com and do not constitute financial advice. Always do your own research.


