

ETHUSD Medium-term Trend: Ranging
Resistance: $760, $750, $740
Support: $700, $710, $720
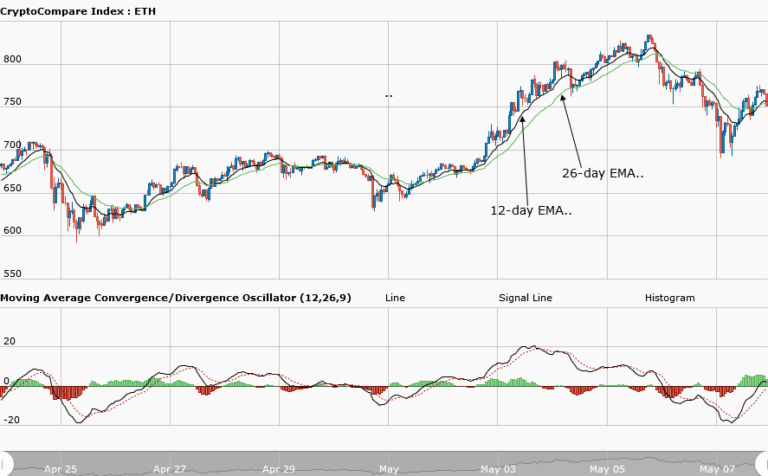
Yesterday, May 7, the price of Ethereum broke the bullish trend line and the candlestick closed on the opposite of the trend line, thus ending the current trend. Also, the 12-day EMA and 26-day EMA were above the falling price bars indicating that Ethereum was in a bearish outlook. Today, the asset is currently trading at $752.63 as at the time of writing.H owever, looking at the weekly chart the price of Ethereum is ranging above the resistance level of $750.
The asset is poised to retest the resistance level of $775 where the price pulled back so as to reach the highs of $800 and $900. However, if the Bulls fail to sustain the price at the current level, Ethereum will fall and find support at $700 level.
ETHUSD Short-term trend: Ranging

On the daily chart, the MACD line and the signal line are still below the zero line indicating that Ethereum is still bearish. In addition, the 12-day EMA and the 26-day EMA are above the price bars indicating a fall in the price of the asset. However looking at the price action, Ethereum has fallen to the low of $700 and it made a bullish movement to the high of $760. Later, it commenced a range bound movement.
The views and opinions expressed here do not reflect that of CryptoGlobe.com and do not constitute financial advice. Always do your own research.


